Operations
After you complete Upload, Preprocessing, Analysis, Training, and Results in Rassket, the Operations area is where grid, control room, and demand-side teams turn forecasts into timely action. It shows predicted peaks, risk, cost impact, when to act, and a live alert feed — all in plain language.
What does this do?
The Operations view reads from your trained load (or related) model and presents a control-room-style summary: today's expected peak, the time window when that peak is likely, how uncertain the forecast is, what could drive costs up or down, and concrete steps your team can take before the peak arrives.
Why does it matter?
Forecasts in a spreadsheet do not tell operators when to call demand response or why the peak moved. Operations closes that gap so planning and operations work from the same numbers and the same recommended timing — without anyone writing SQL or re-building charts by hand.
Rassket app steps (end to end)
In the product, the main flow follows these stages:
- Upload — bring in data or connect a live source
- Preprocessing — validate and prepare the dataset
- Analysis — confirm targets, problem type, and data quality
- Training — build the prediction model
- Results — metrics, charts, exports, and chat
- Operations — run-the-grid view for peaks, drivers, outlook, and alerts
Command center: peak, risk, cost, and when to act
The top of Operations highlights the numbers operators watch first: predicted peak (MW), the peak time band, a risk score with a simple level (for example normal, elevated, or high), and a confidence band (such as a central estimate plus an upper scenario like a P95). Below that, Rassket ties the forecast to money and to a recommended action window — the period when demand response, customer curtailment, or pre-cooling is most likely to help — and lists suggested operational moves in plain English.
- Cost impact — estimated demand charges for today and how costs shift if peak is higher or lower than expected (based on your utility's tariff context).
- Action window — when the peak is expected and the best window to act (often a few hours ahead of the peak).
- Alerts feed — time-stamped notices such as peak risk crossing a threshold, weather revisions that moved the forecast, or conditions returning to normal.
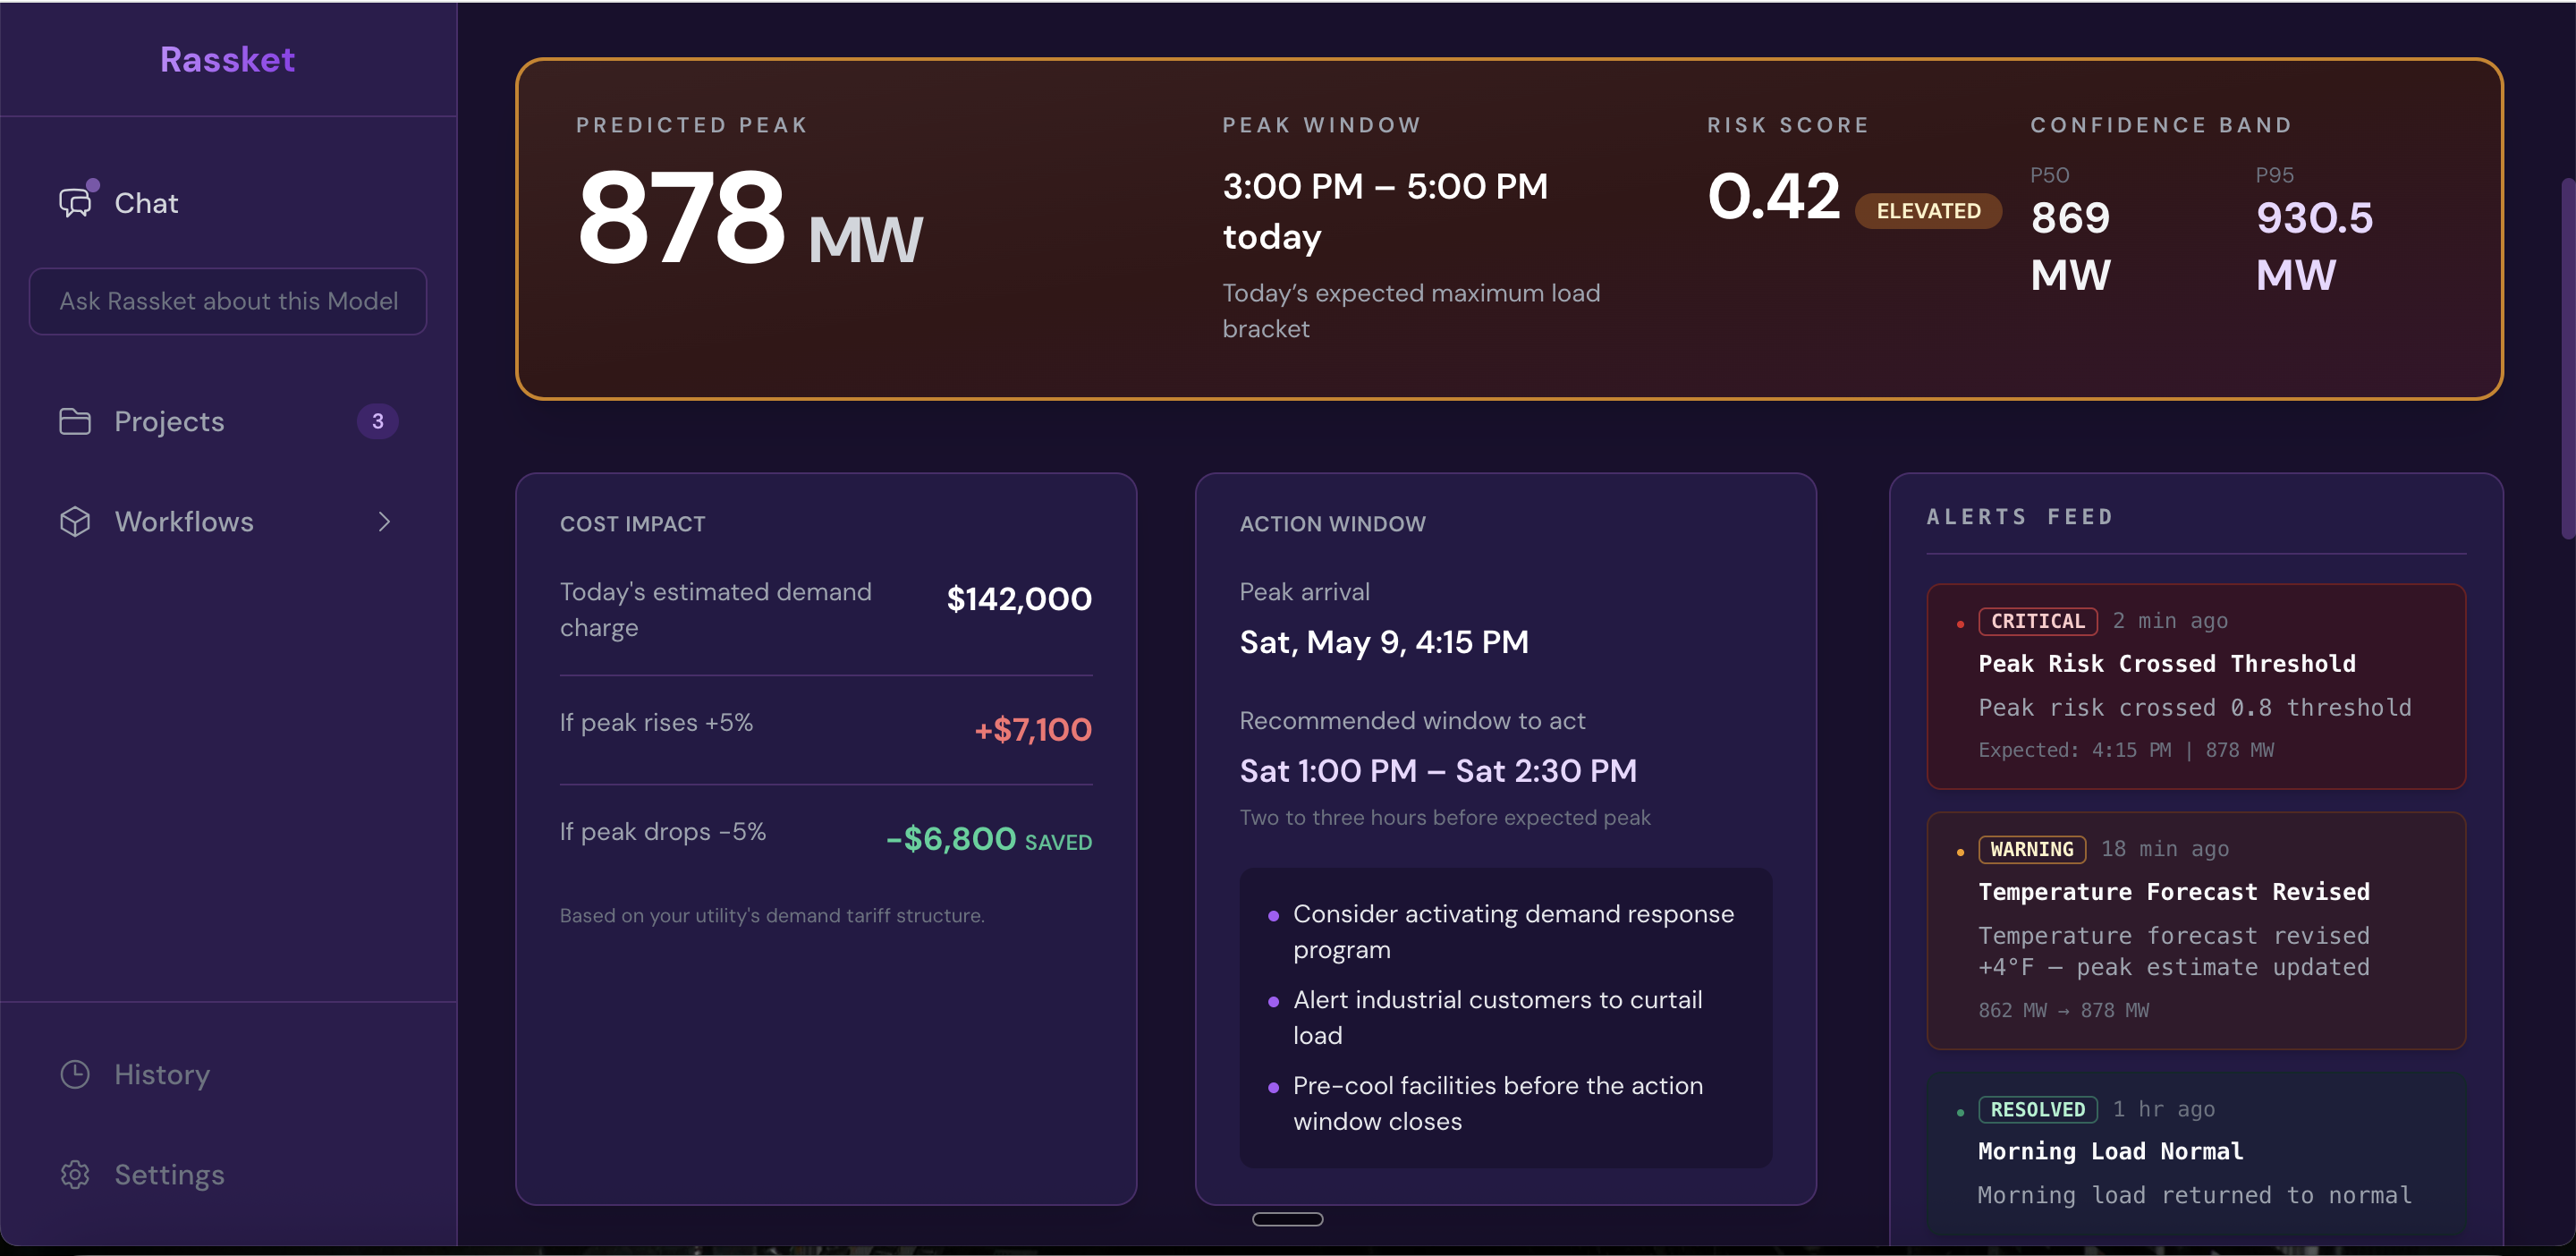
Operations command center — peak, risk, confidence, cost scenarios, when to act, and live alerts in one view (screenshot illustrates the product UI).
Load forecast with horizons and confidence
The load chart shows forecasted MW over selectable horizons (for example 24, 48, or 72 hours). A shaded band shows the forecast uncertainty (such as P10–P90). Markers show now and the expected peak. Hovering or selecting a point shows the central forecast and interval at that time so operators can align shifts and calls to large customers with the same curve.
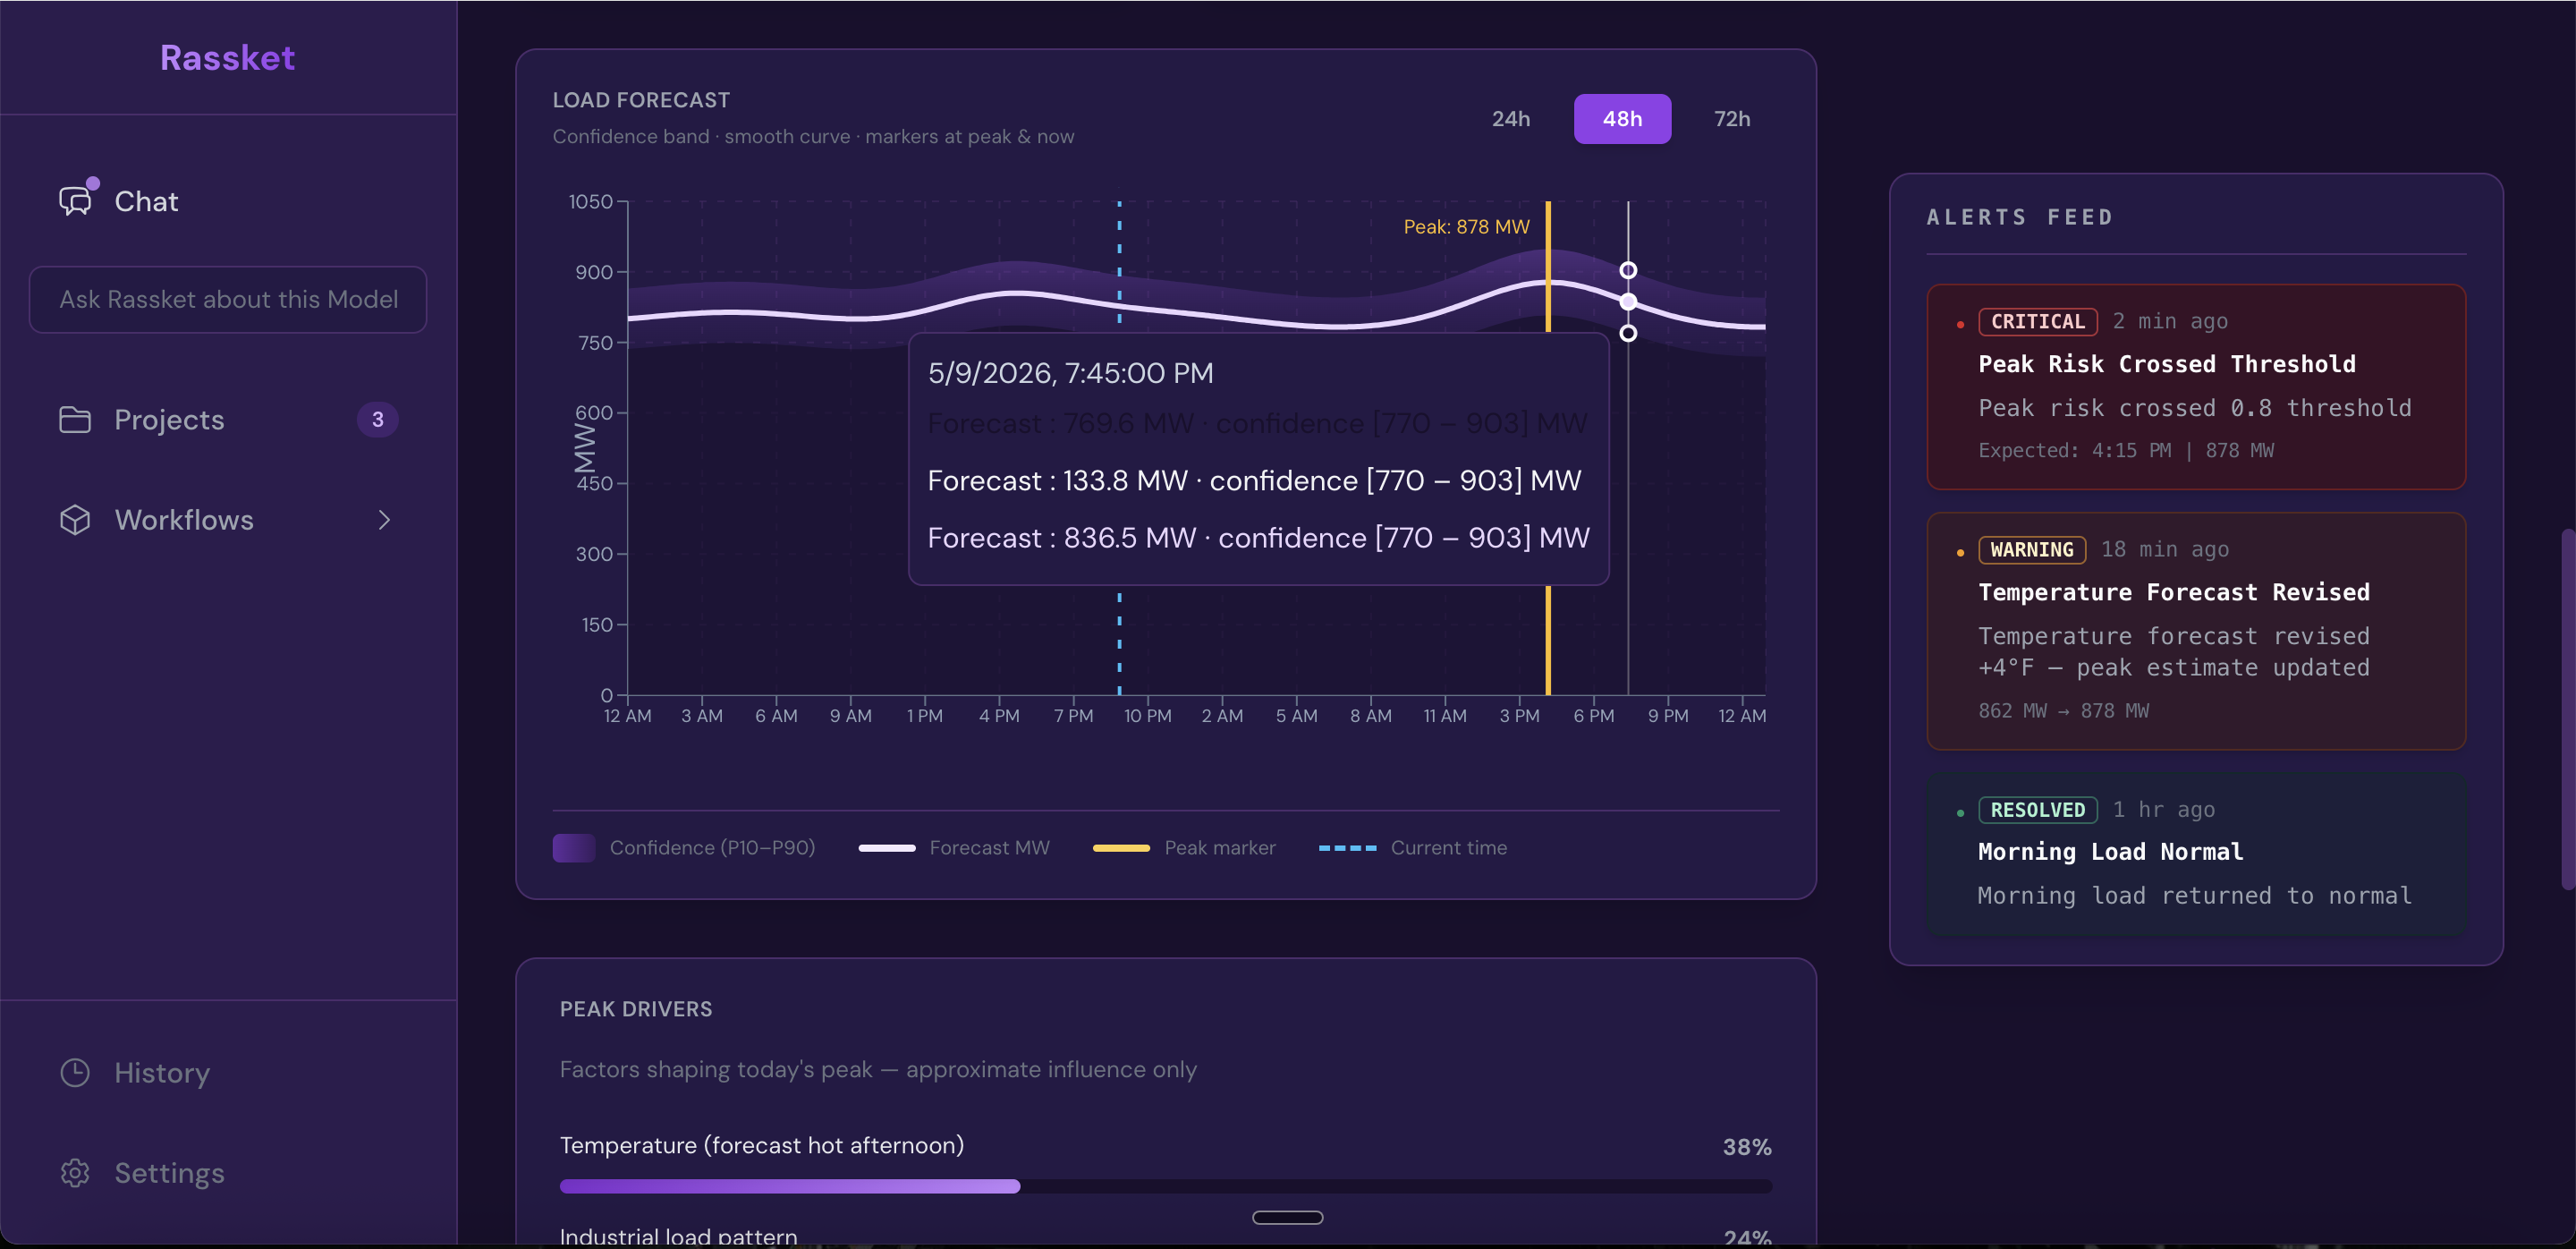
Load forecast for operations — pick the horizon, read the band, and watch peak and “now” on the same curve.
Peak drivers, insight, seven-day outlook
Peak drivers explain what is pushing today's peak (for example hot-afternoon temperature, industrial load shape, weekday profile, or carryover from the prior day). Bars show approximate share of influence. A short operational insight turns that into guidance — for example when pre-cooling or demand response is likely to help most.
The seven-day outlook summarizes predicted peak or daily load (MW) by day with a simple status so planners can spot which days need extra attention across the week.
The alerts feed stays visible here too so drivers, outlook, and notifications stay in sync.
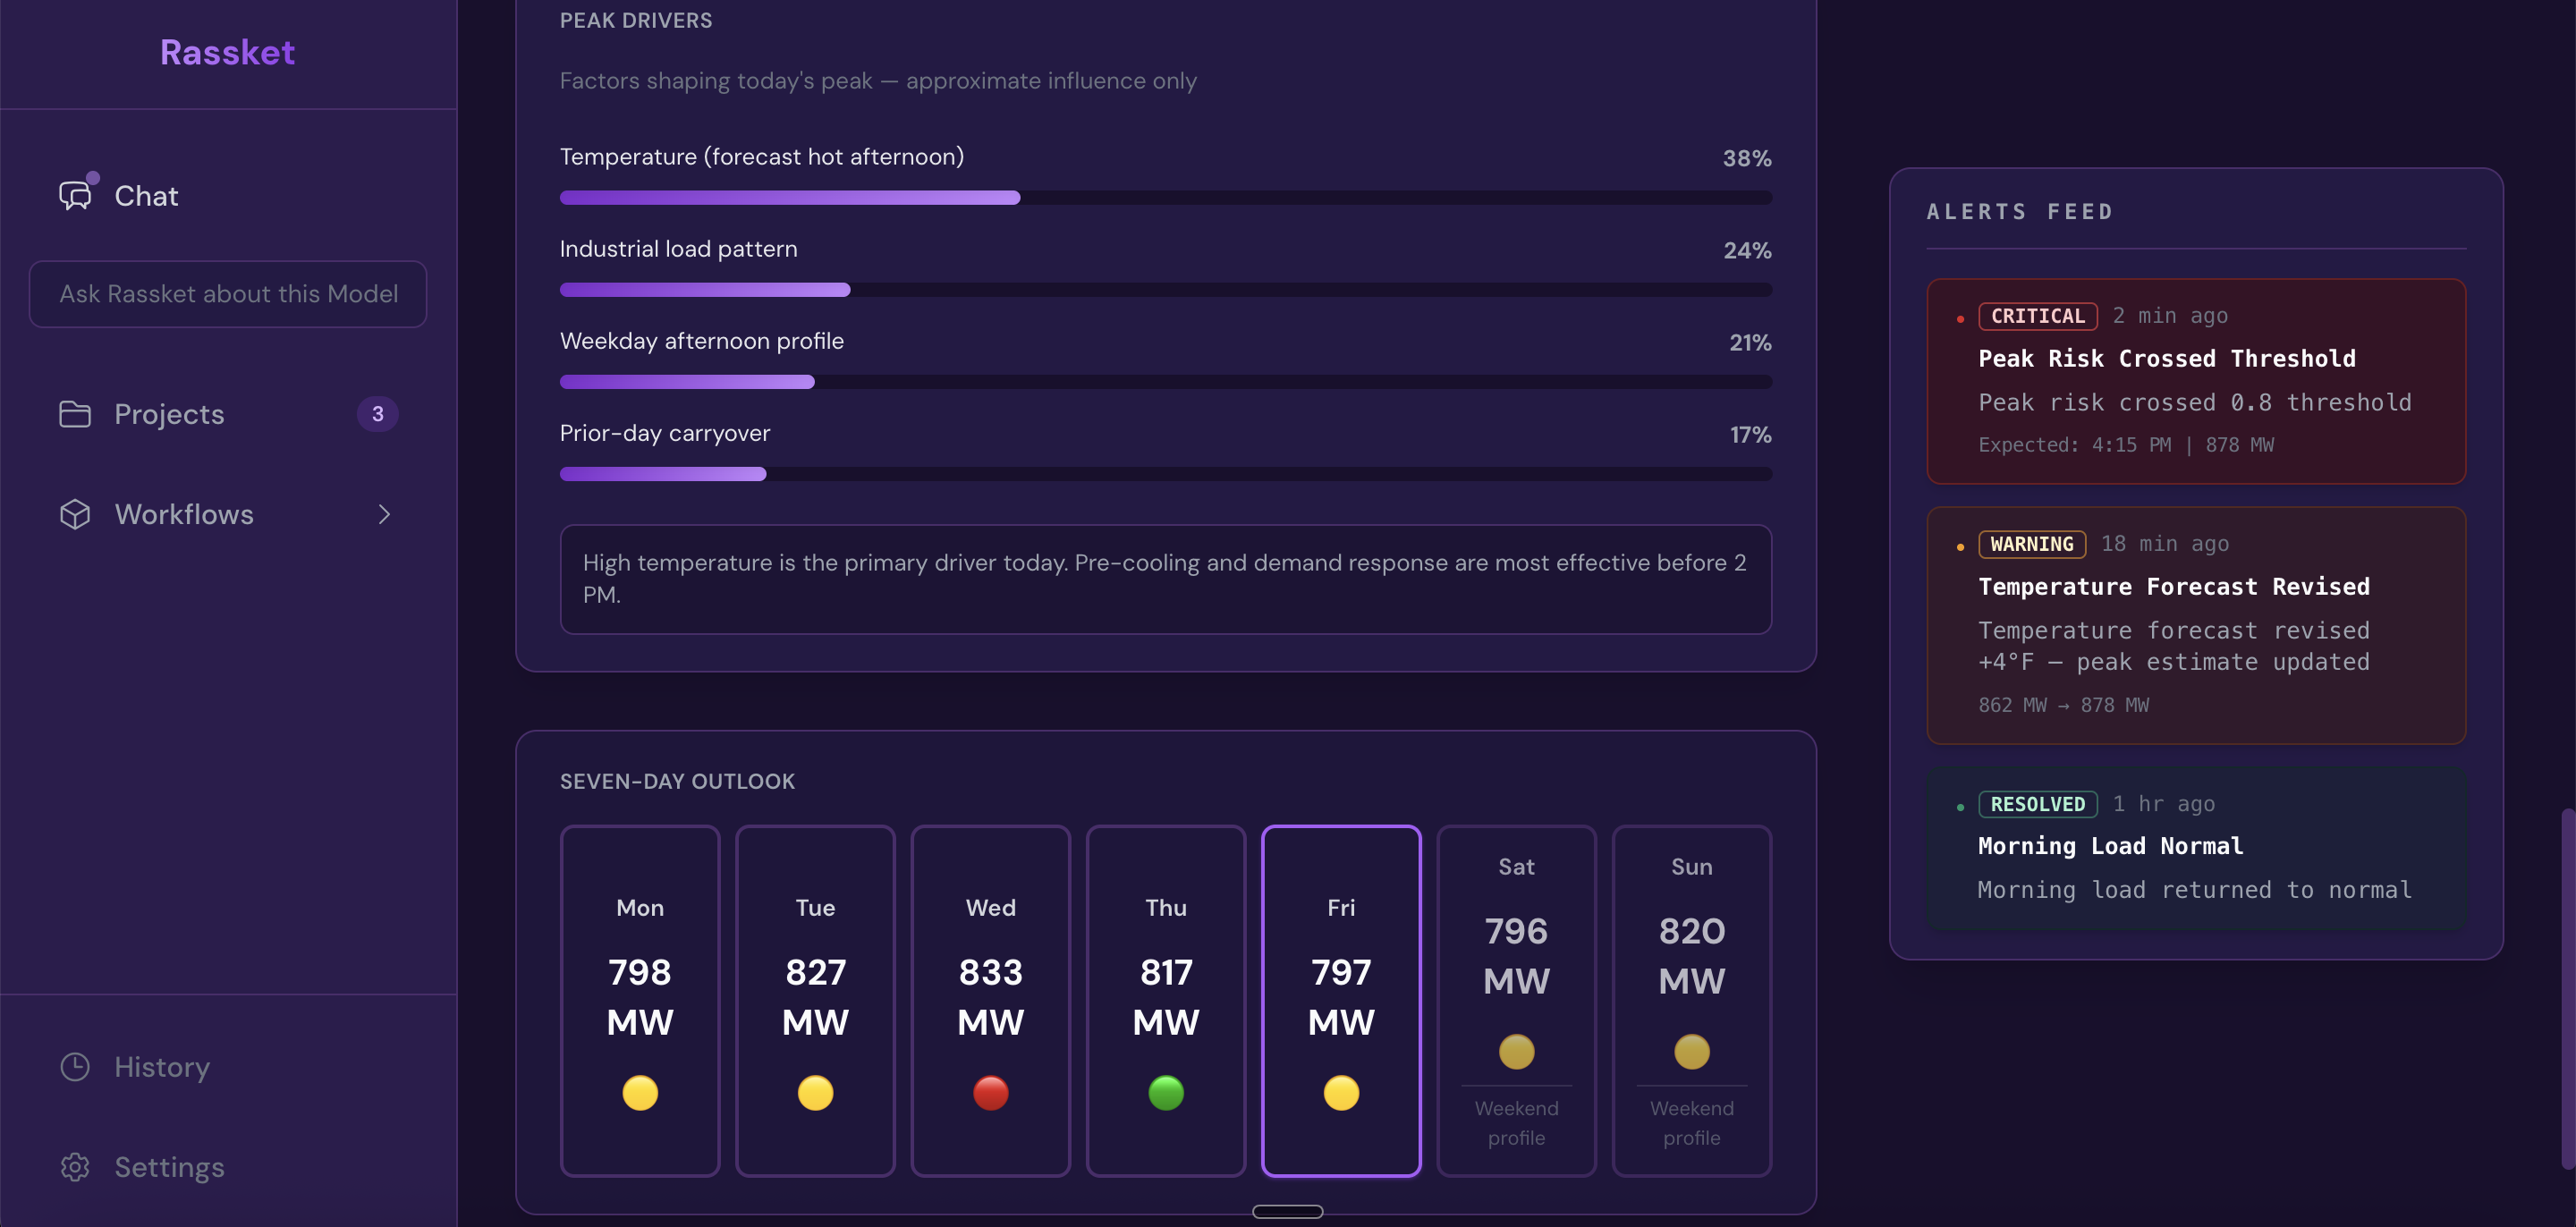
Peak drivers, plain-English guidance, weekly outlook, and alerts — built for operators who need to act, not re-model.
How your team should use Operations
- Confirm the headline peak and time band — line up internal peak outlooks with Rassket's predicted MW and window.
- Check risk and the confidence band — plan extra headroom when the upper scenario is materially higher than the central forecast.
- Read the action window — stage demand response, industrial notifications, or building pre-cool before that window closes.
- Use peak drivers — if temperature dominates, prioritize weather-linked measures; if industrial pattern dominates, focus on large loads.
- Scan the alerts — treat threshold crossings and forecast revisions as triggers to refresh the operational plan for the rest of the day.
- Use Chat (sidebar in the app) — ask Rassket about this model in plain English when you need a quick clarification without leaving the Operations screen.
Where to go next
- How It Works — full walkthrough including Operations as step 6
- Insights & Exports — PDF, CSV, and API from Results
- FAQ — common product questions