How It Works
In the Rassket app the full flow is: Upload → Preprocessing → Analysis → Training → Results → Operations. Domain selection happens early in the workflow (see Domain Selection). Getting Started covers Upload and Connect. This page walks through Preprocessing (step 3), Training / model building (step 4), Results (step 5), and the Operations control-room view (step 6). For a dedicated guide to the Operations screens, see Operations.
Step 3 — Preprocessing
What does this do?
Before training starts, Rassket automatically validates and prepares your data. This includes detecting structure problems, filling gaps, and engineering the features that energy prediction models need.
Why does it matter?
Bad data leads to bad forecasts. Most forecasting failures happen not because of the model, but because the data going into it was inconsistent or incomplete. Rassket catches these problems before they affect your results.
What Rassket does automatically
- Auto-validation of dataset structure — confirms column types, timestamp formats, and row integrity
- Missing value detection and imputation — fills gaps using methods appropriate for energy time-series data
- Feature detection and preparation — identifies which columns are signals, identifiers, or noise
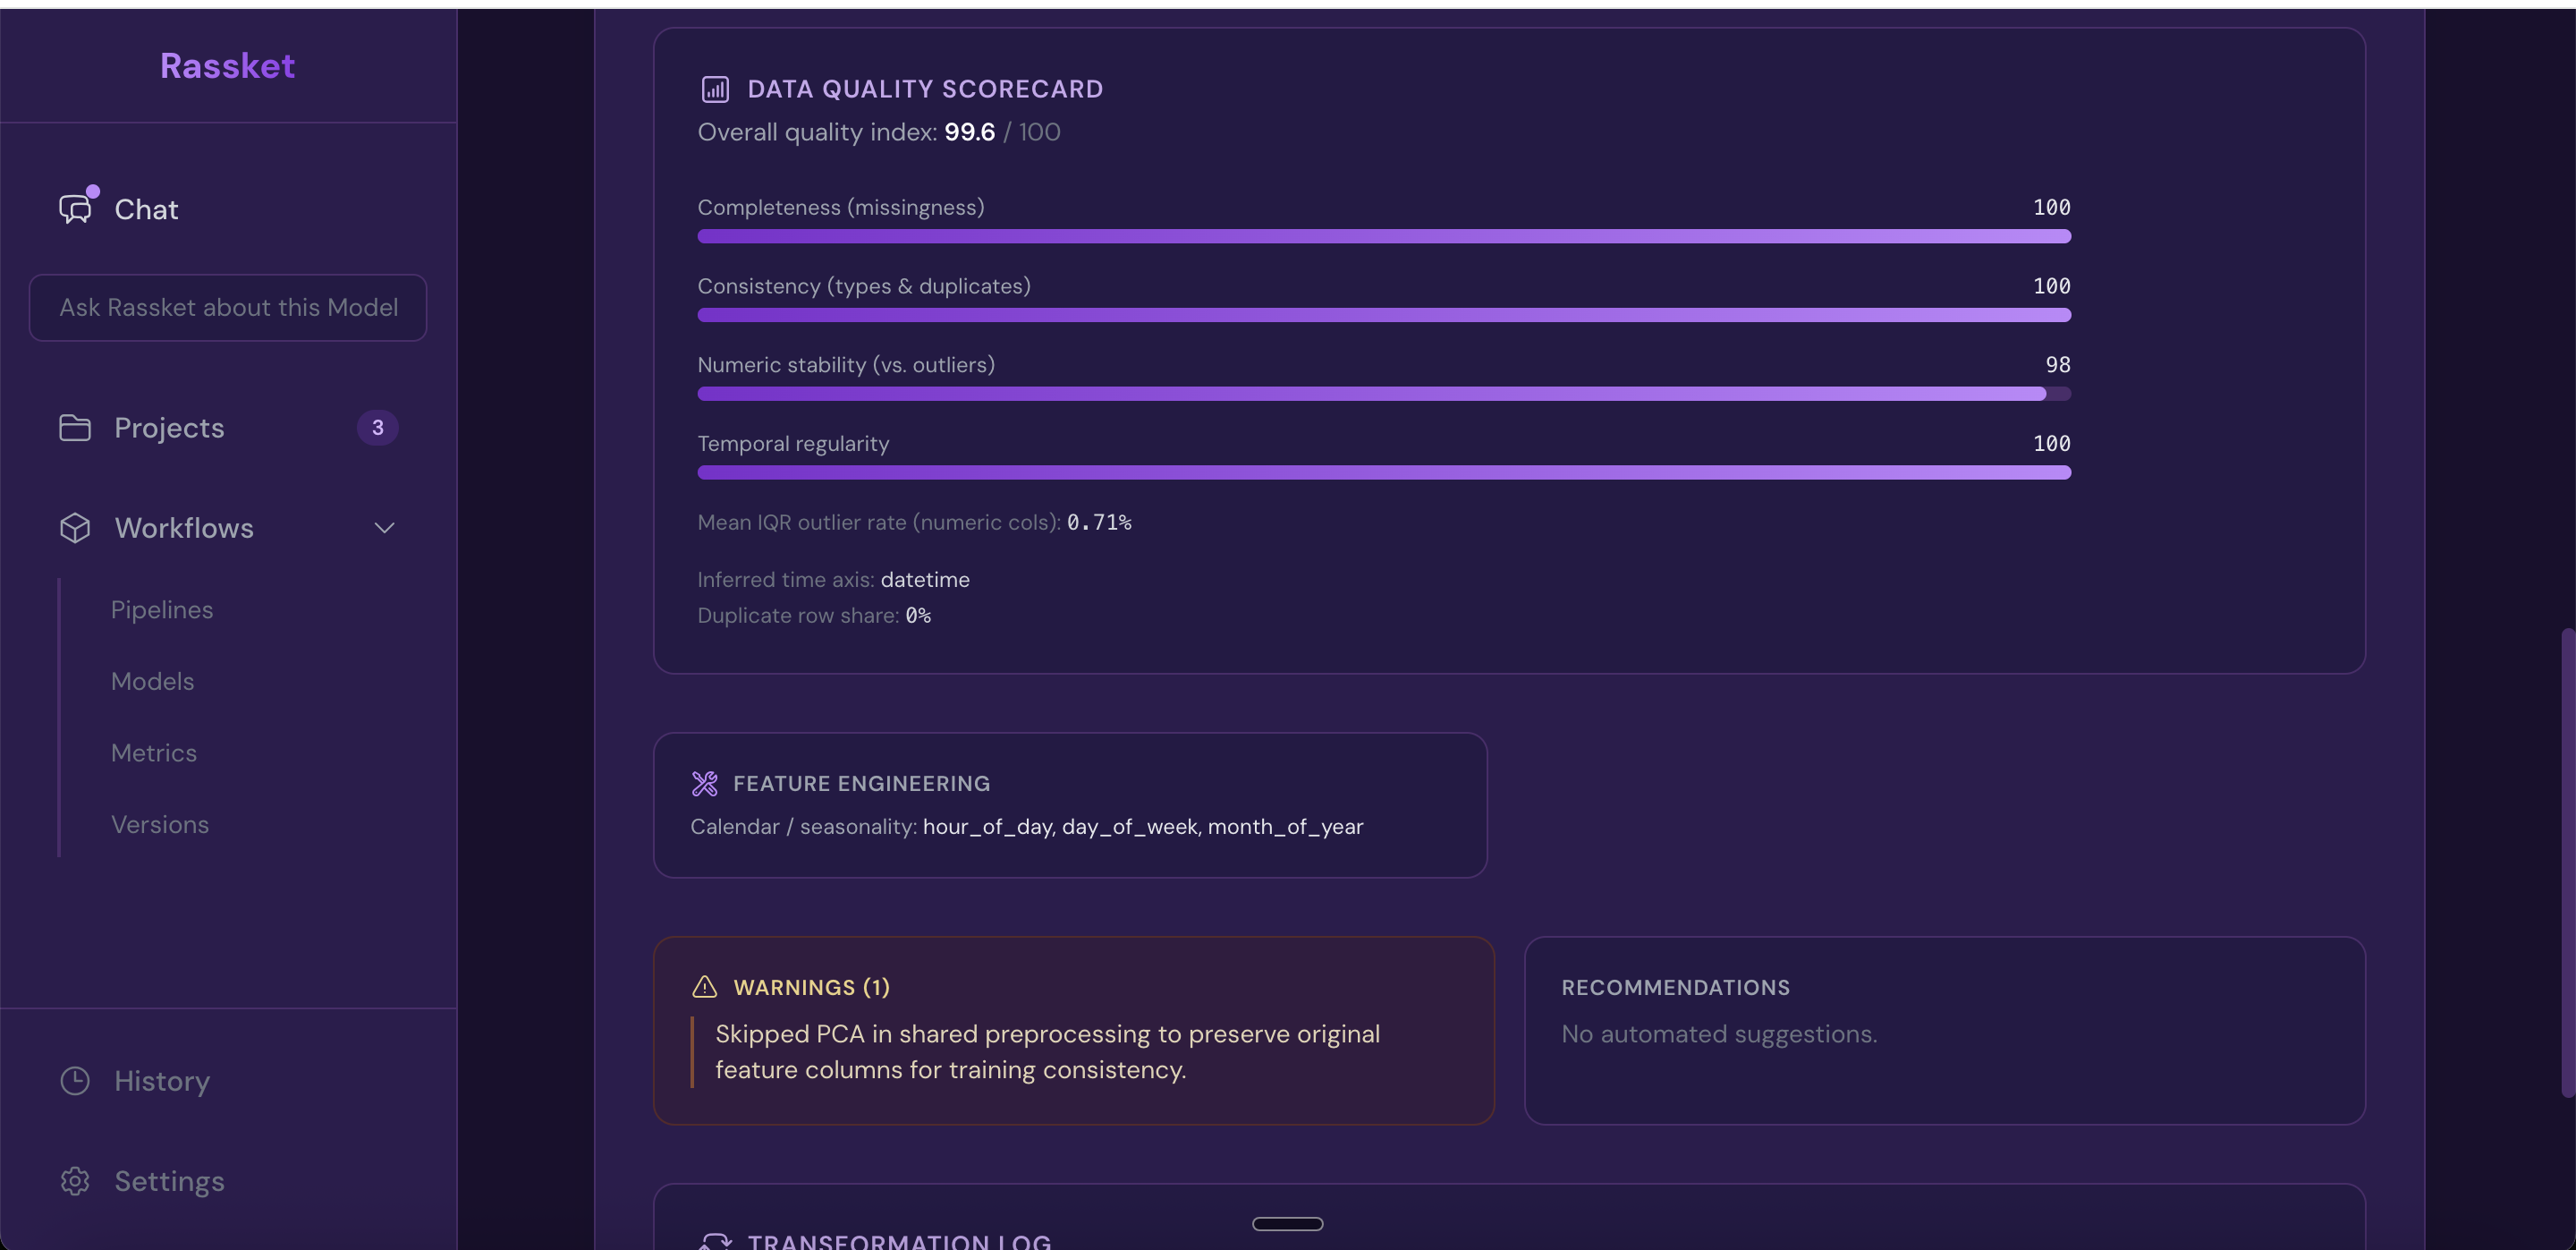
- Data quality report — a full report is generated before training begins so you can review what was found
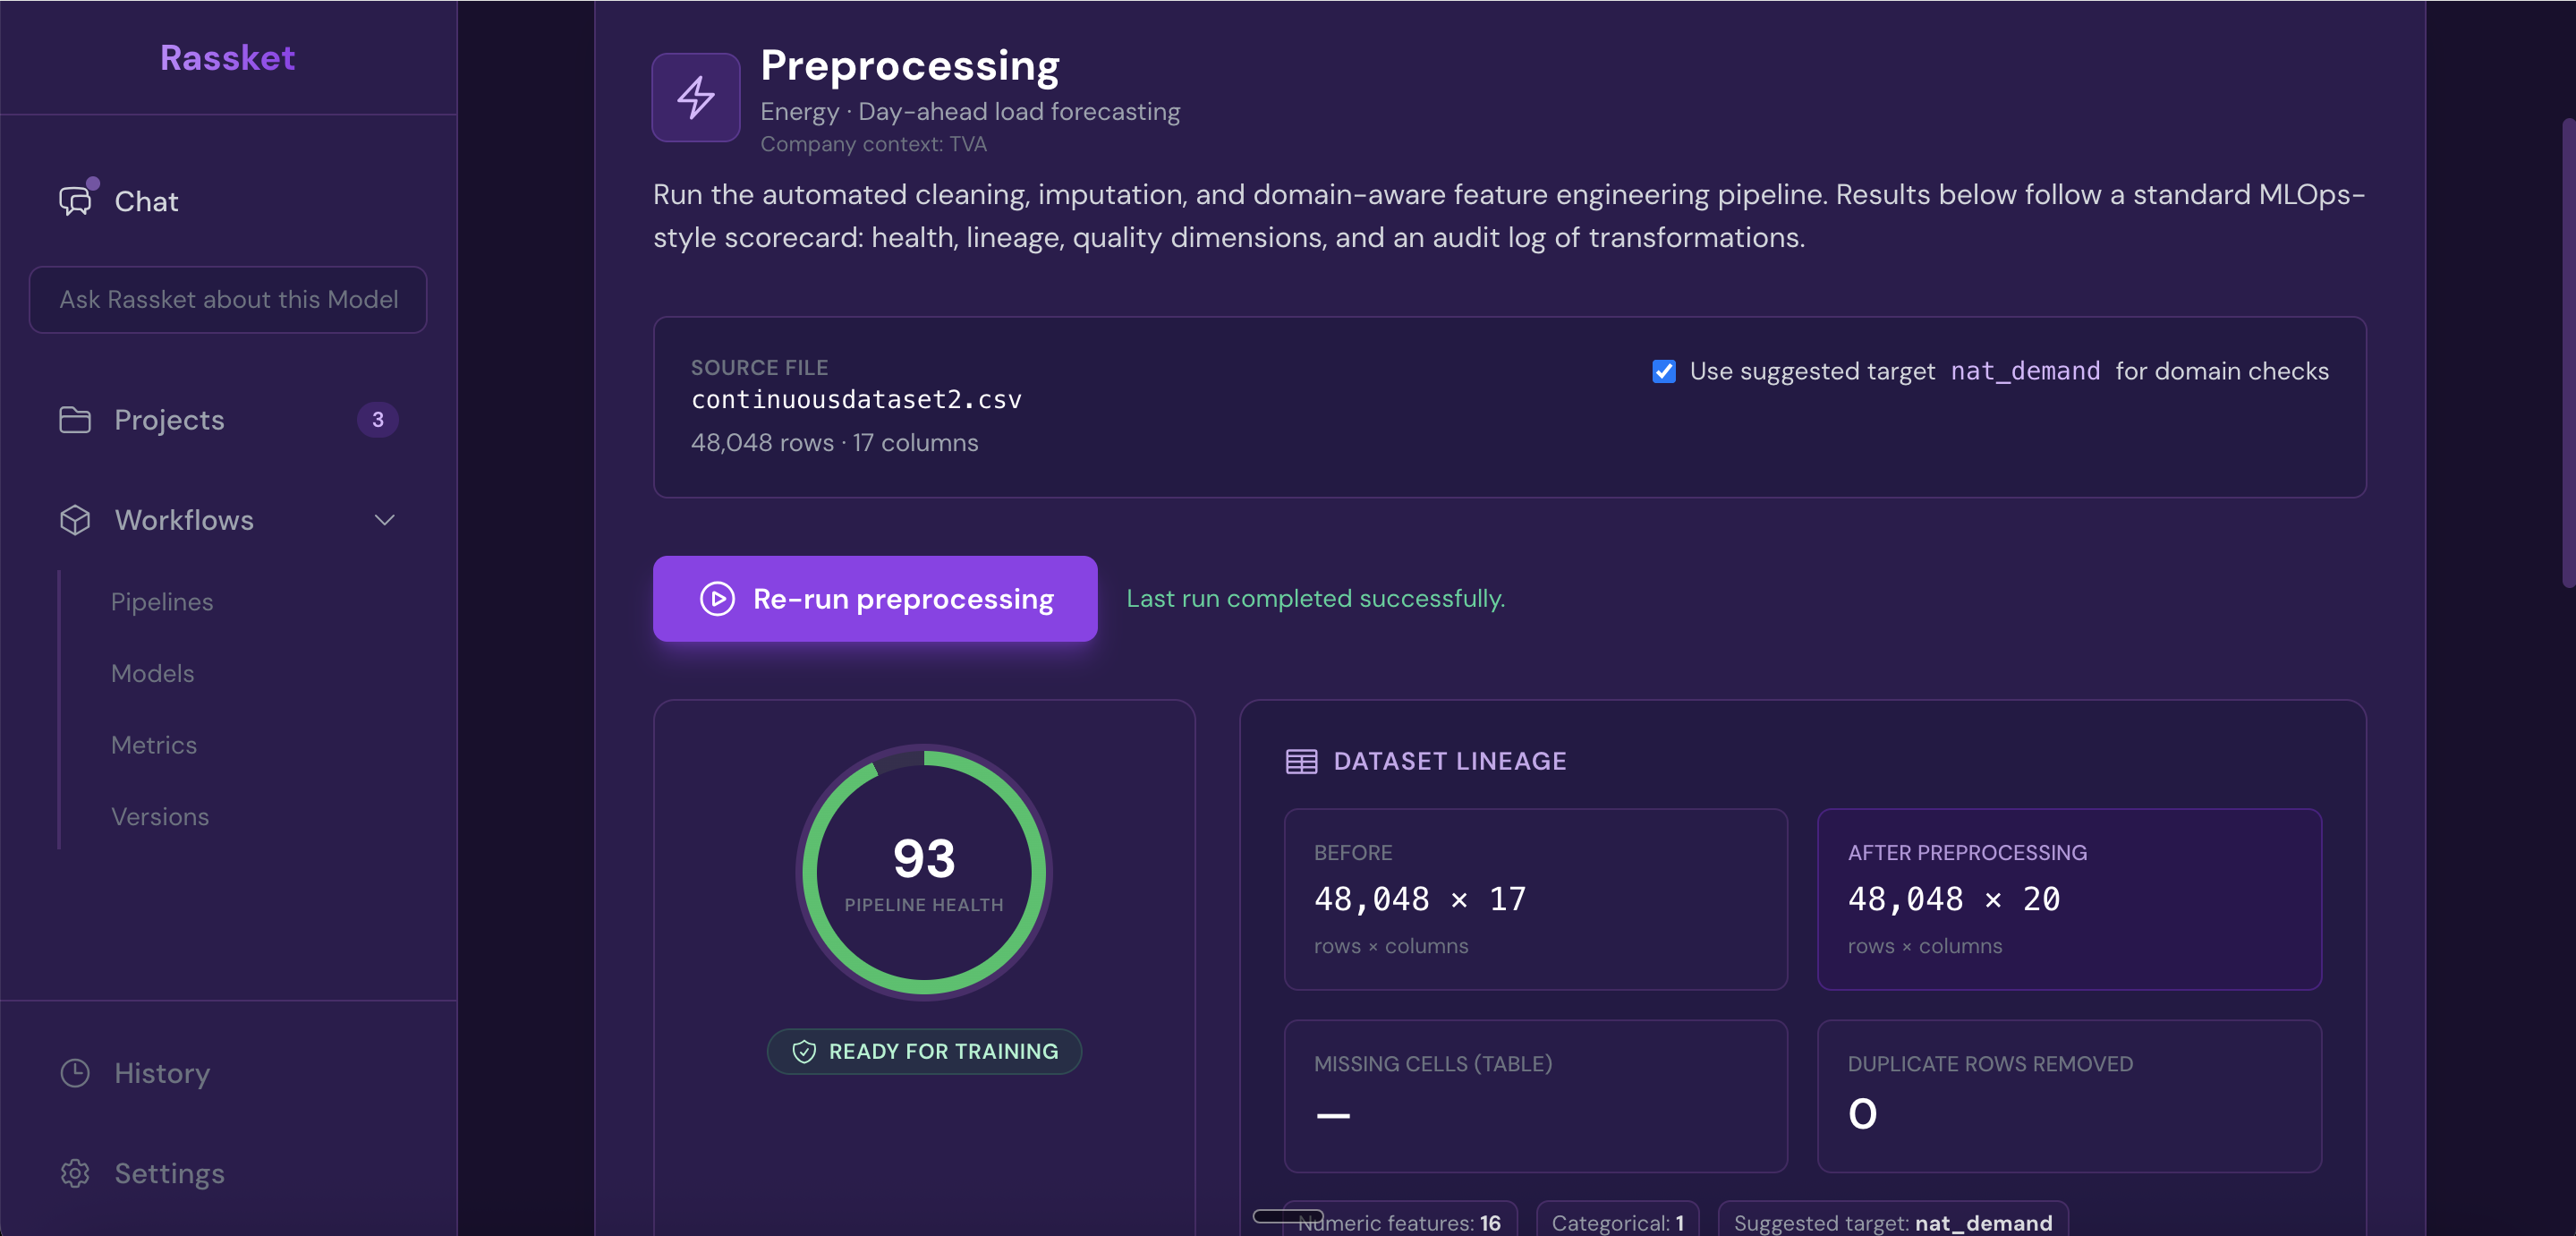
Rassket validates and prepares your data before training begins — no manual cleaning required.
Step 4 — Model Building
What does this do?
Rassket trains a prediction model on your prepared data. It handles everything automatically — selecting the right approach, engineering features, splitting your data correctly, and detecting problems like overfitting before they affect your results.
Why does it matter?
Building a good energy prediction model by hand takes weeks. Getting it wrong is easy — overfitting to historical patterns, leaking future information into training, or picking the wrong features. Rassket handles all of this automatically so you get a reliable model, fast.
What Rassket does automatically
Automatic feature engineering
- Time-of-use (TOU) windows — peak, off-peak, and shoulder period indicators
- Seasonality — hour-of-day, day-of-week, month, and seasonal cycle encoding
- Public holidays — national and regional holiday indicators applied automatically
- Lag features — previous consumption and generation values used to capture temporal patterns
- Weather interactions — where weather data is available, interaction terms with load and generation are created
Model training and validation
- Time-aware cross-validation — data is split respecting time order so that future data never leaks into training
- Overfitting detection — Rassket flags models where the training score exceeds the validation score by more than 15%, and adjusts automatically
- Data leakage detection — features that contain information about the future are identified and removed before training
- Live progress indicator — you can watch training progress in real time
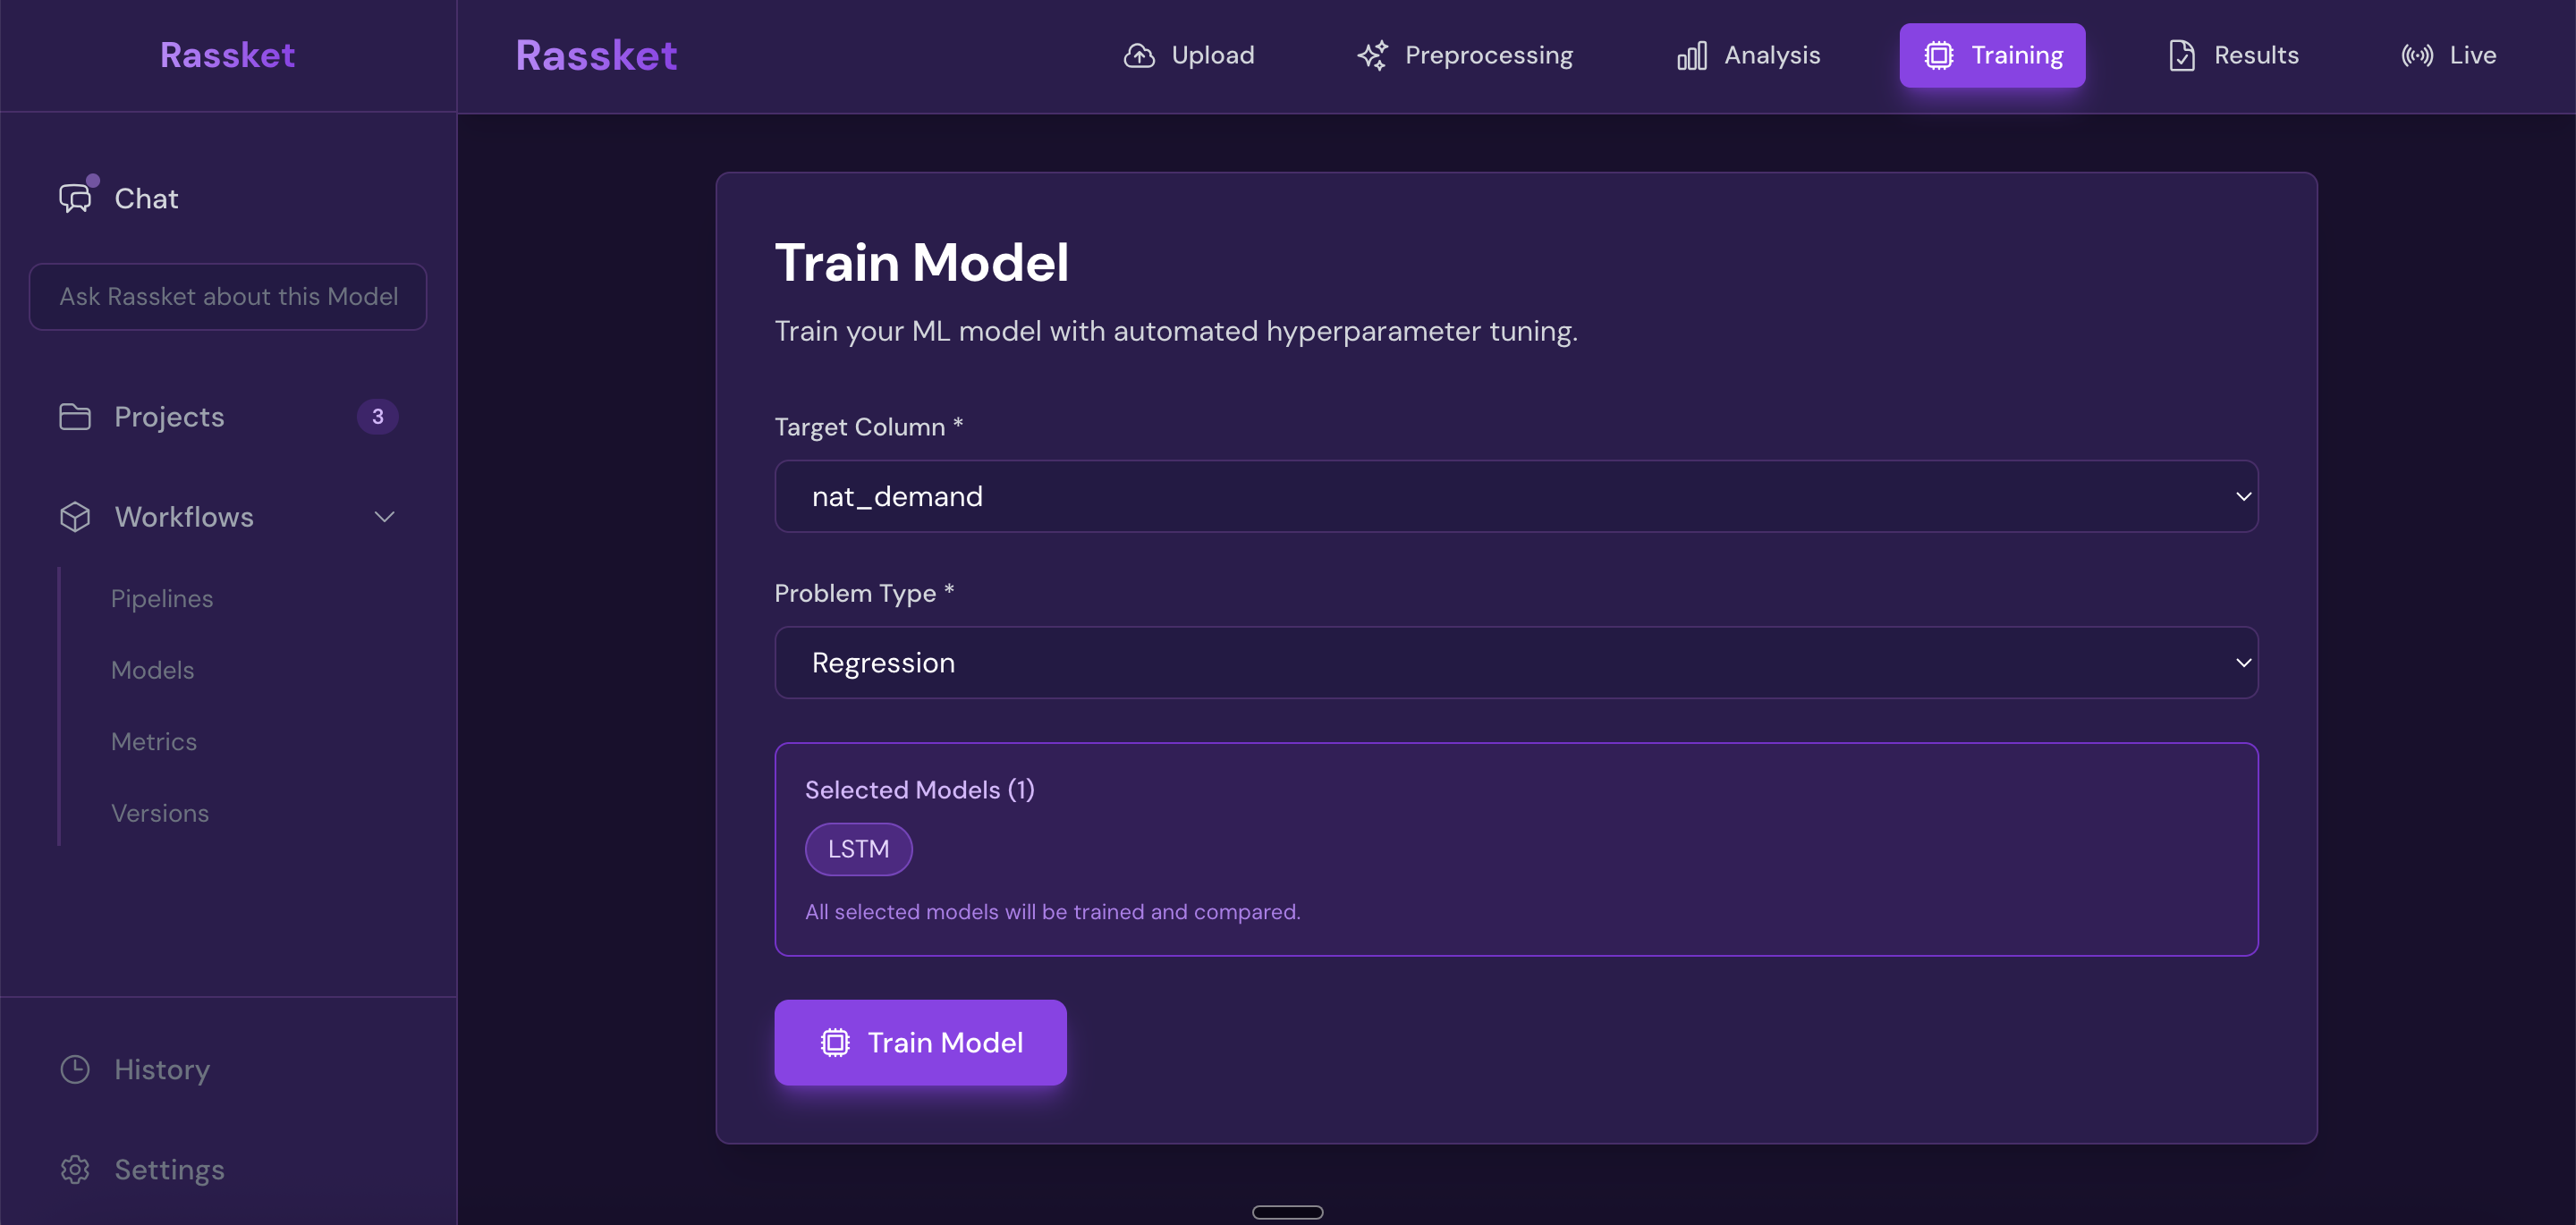
Configure your prediction target and start training — Rassket handles feature engineering and validation automatically.
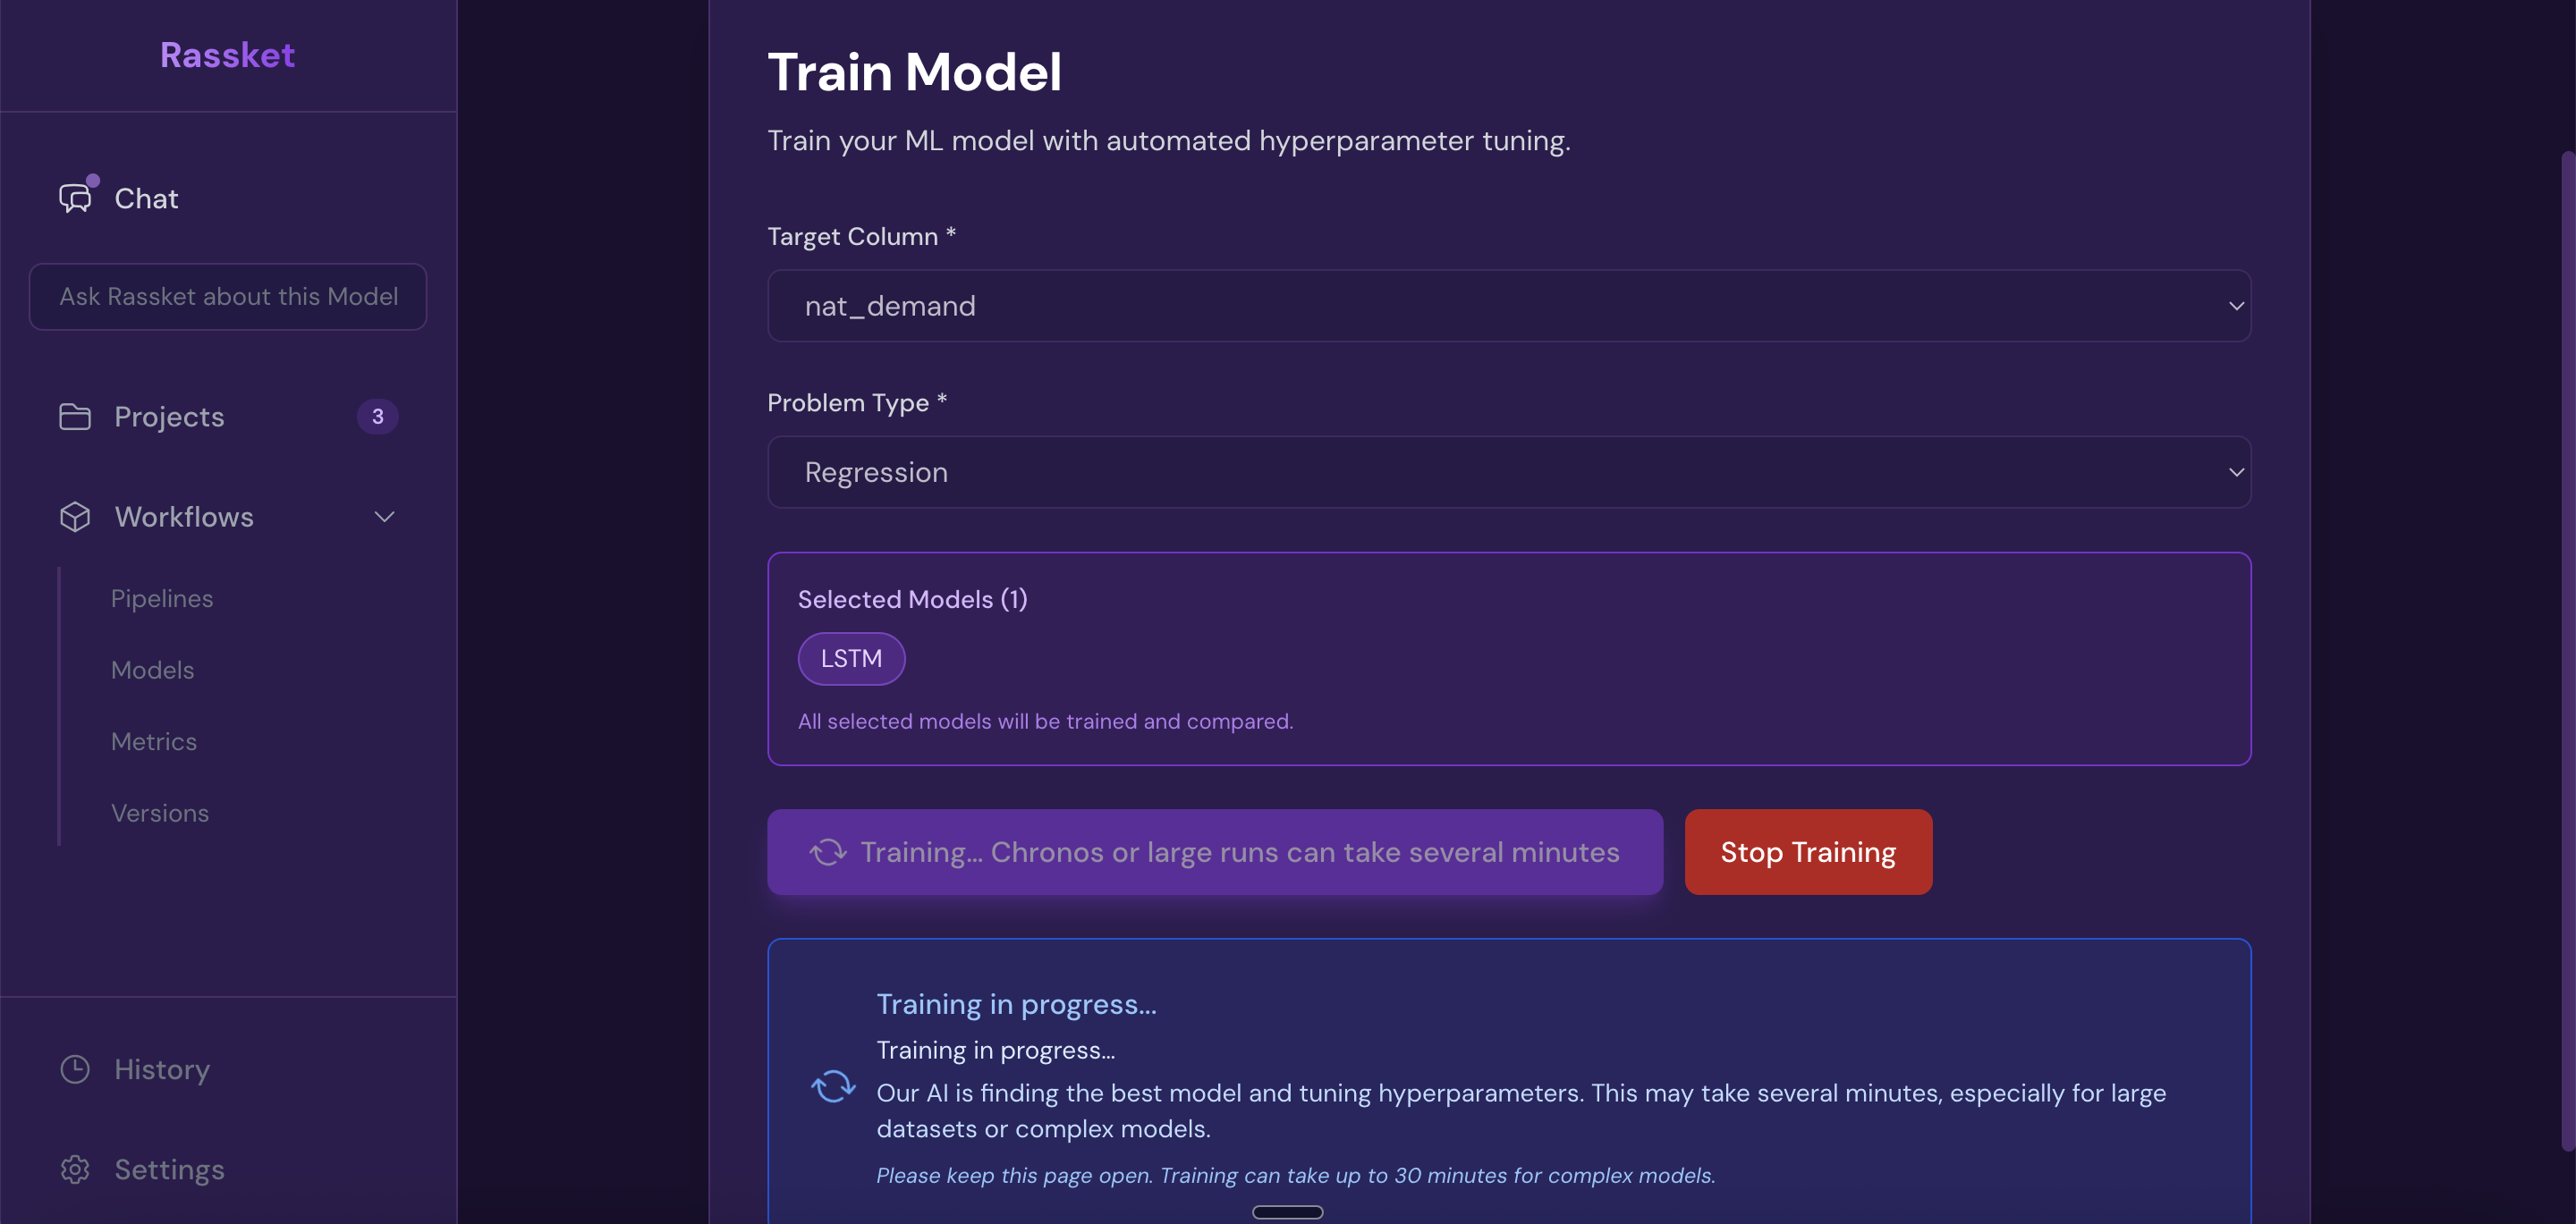
Rassket trains automatically — watch live progress as your model builds.
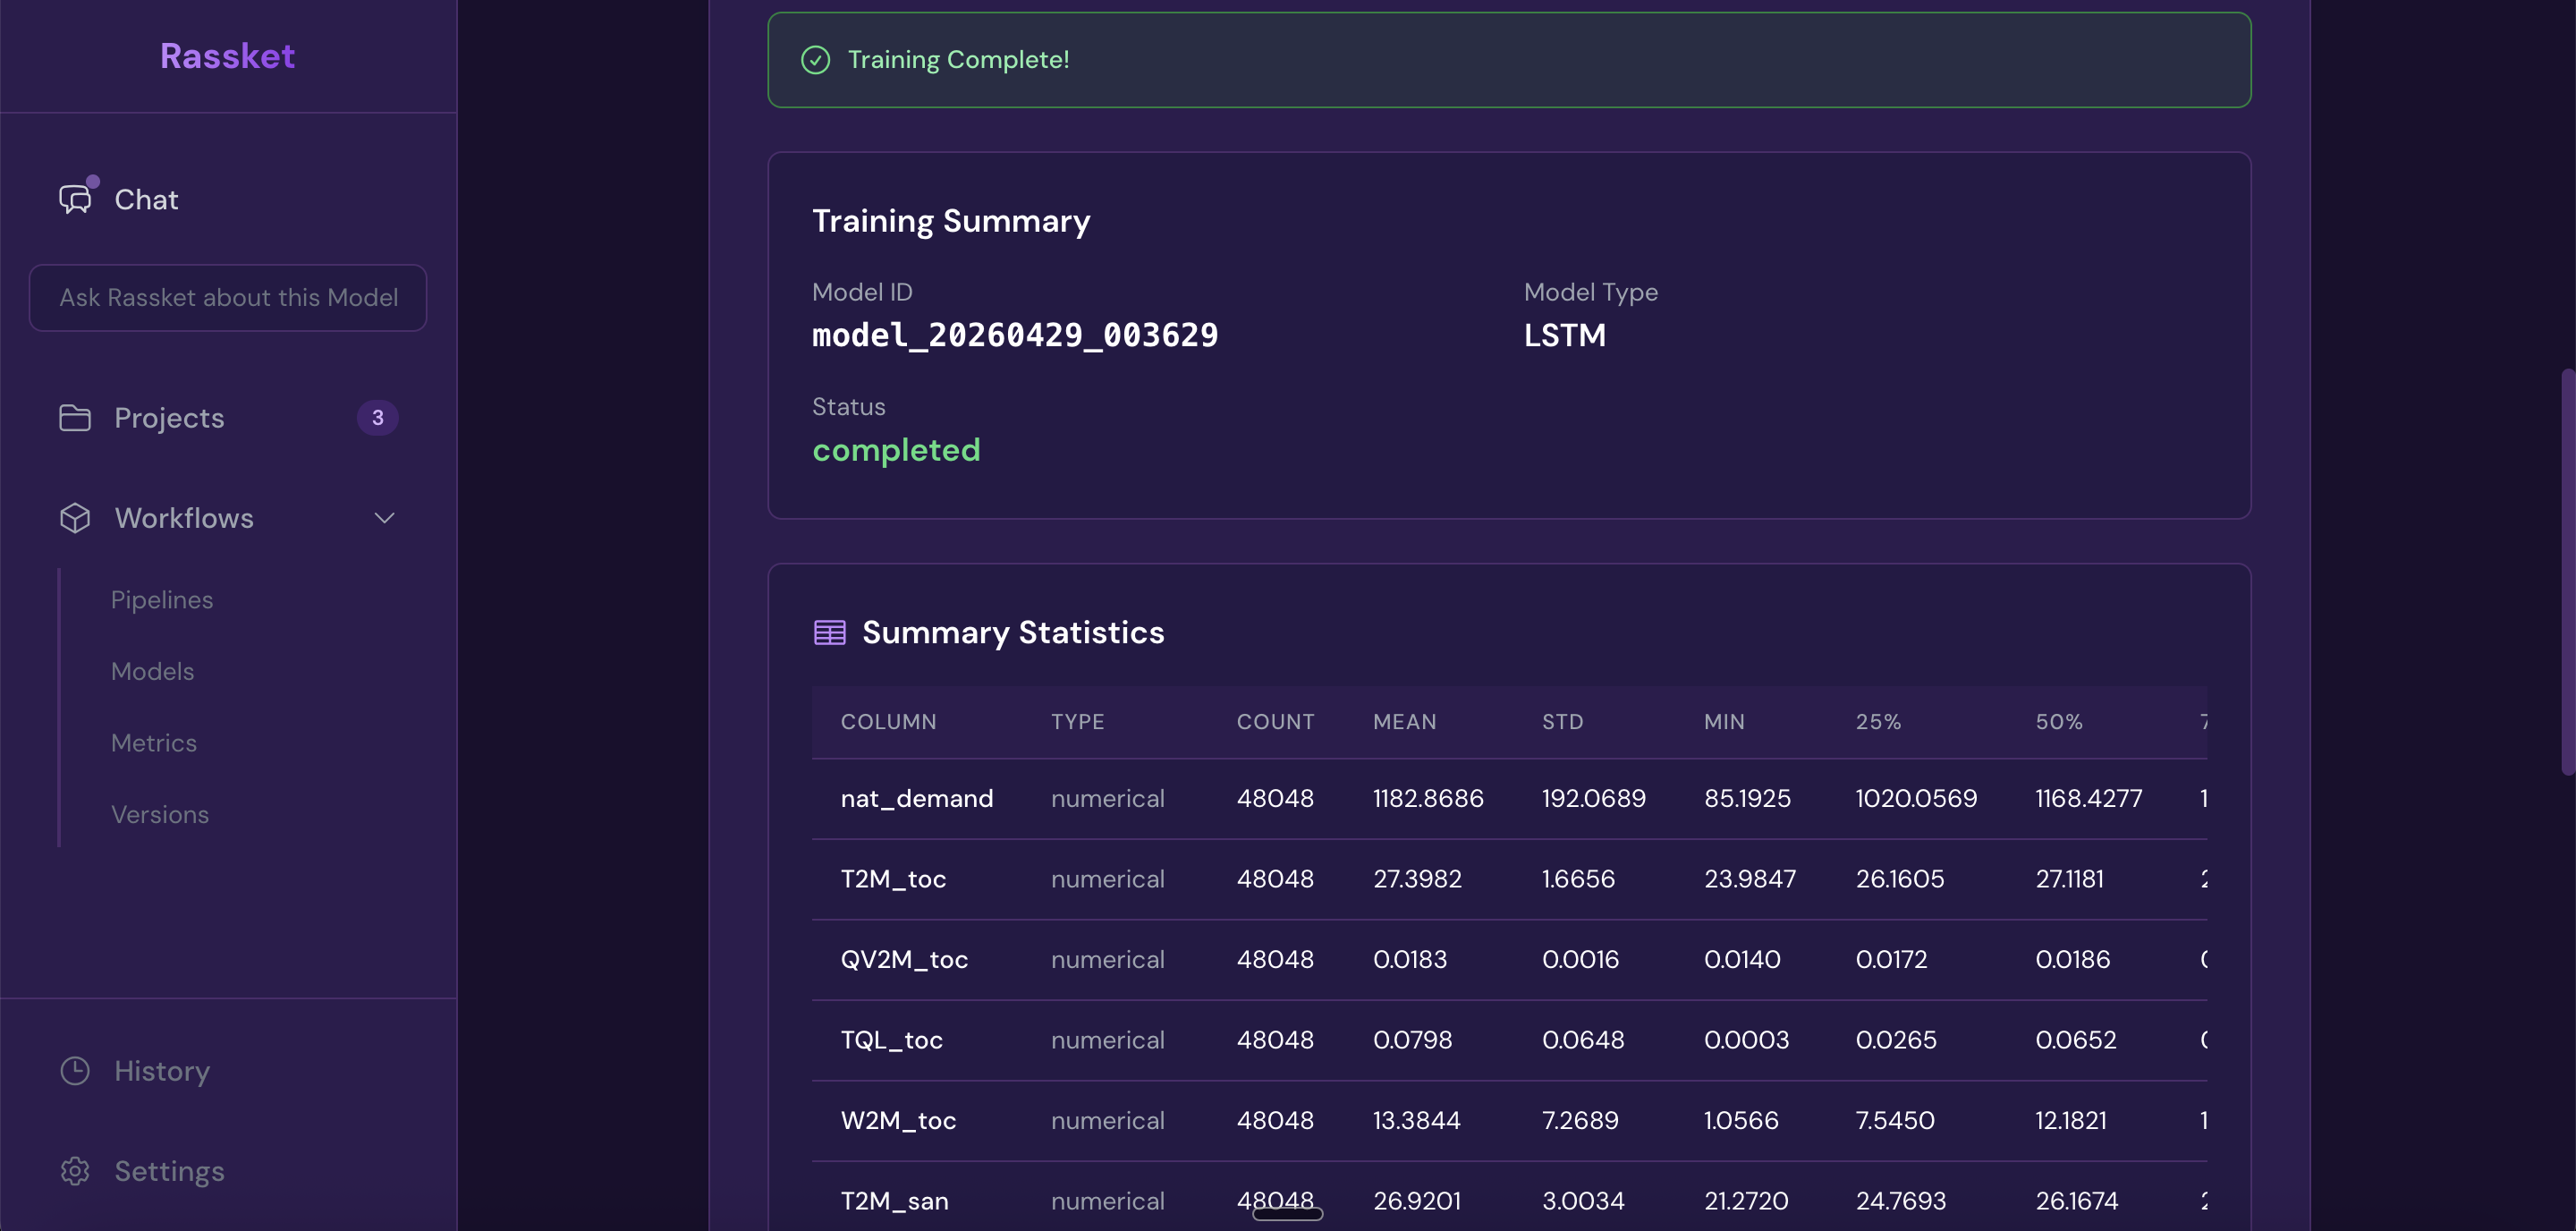
Training complete — your prediction model is ready with a full performance summary.
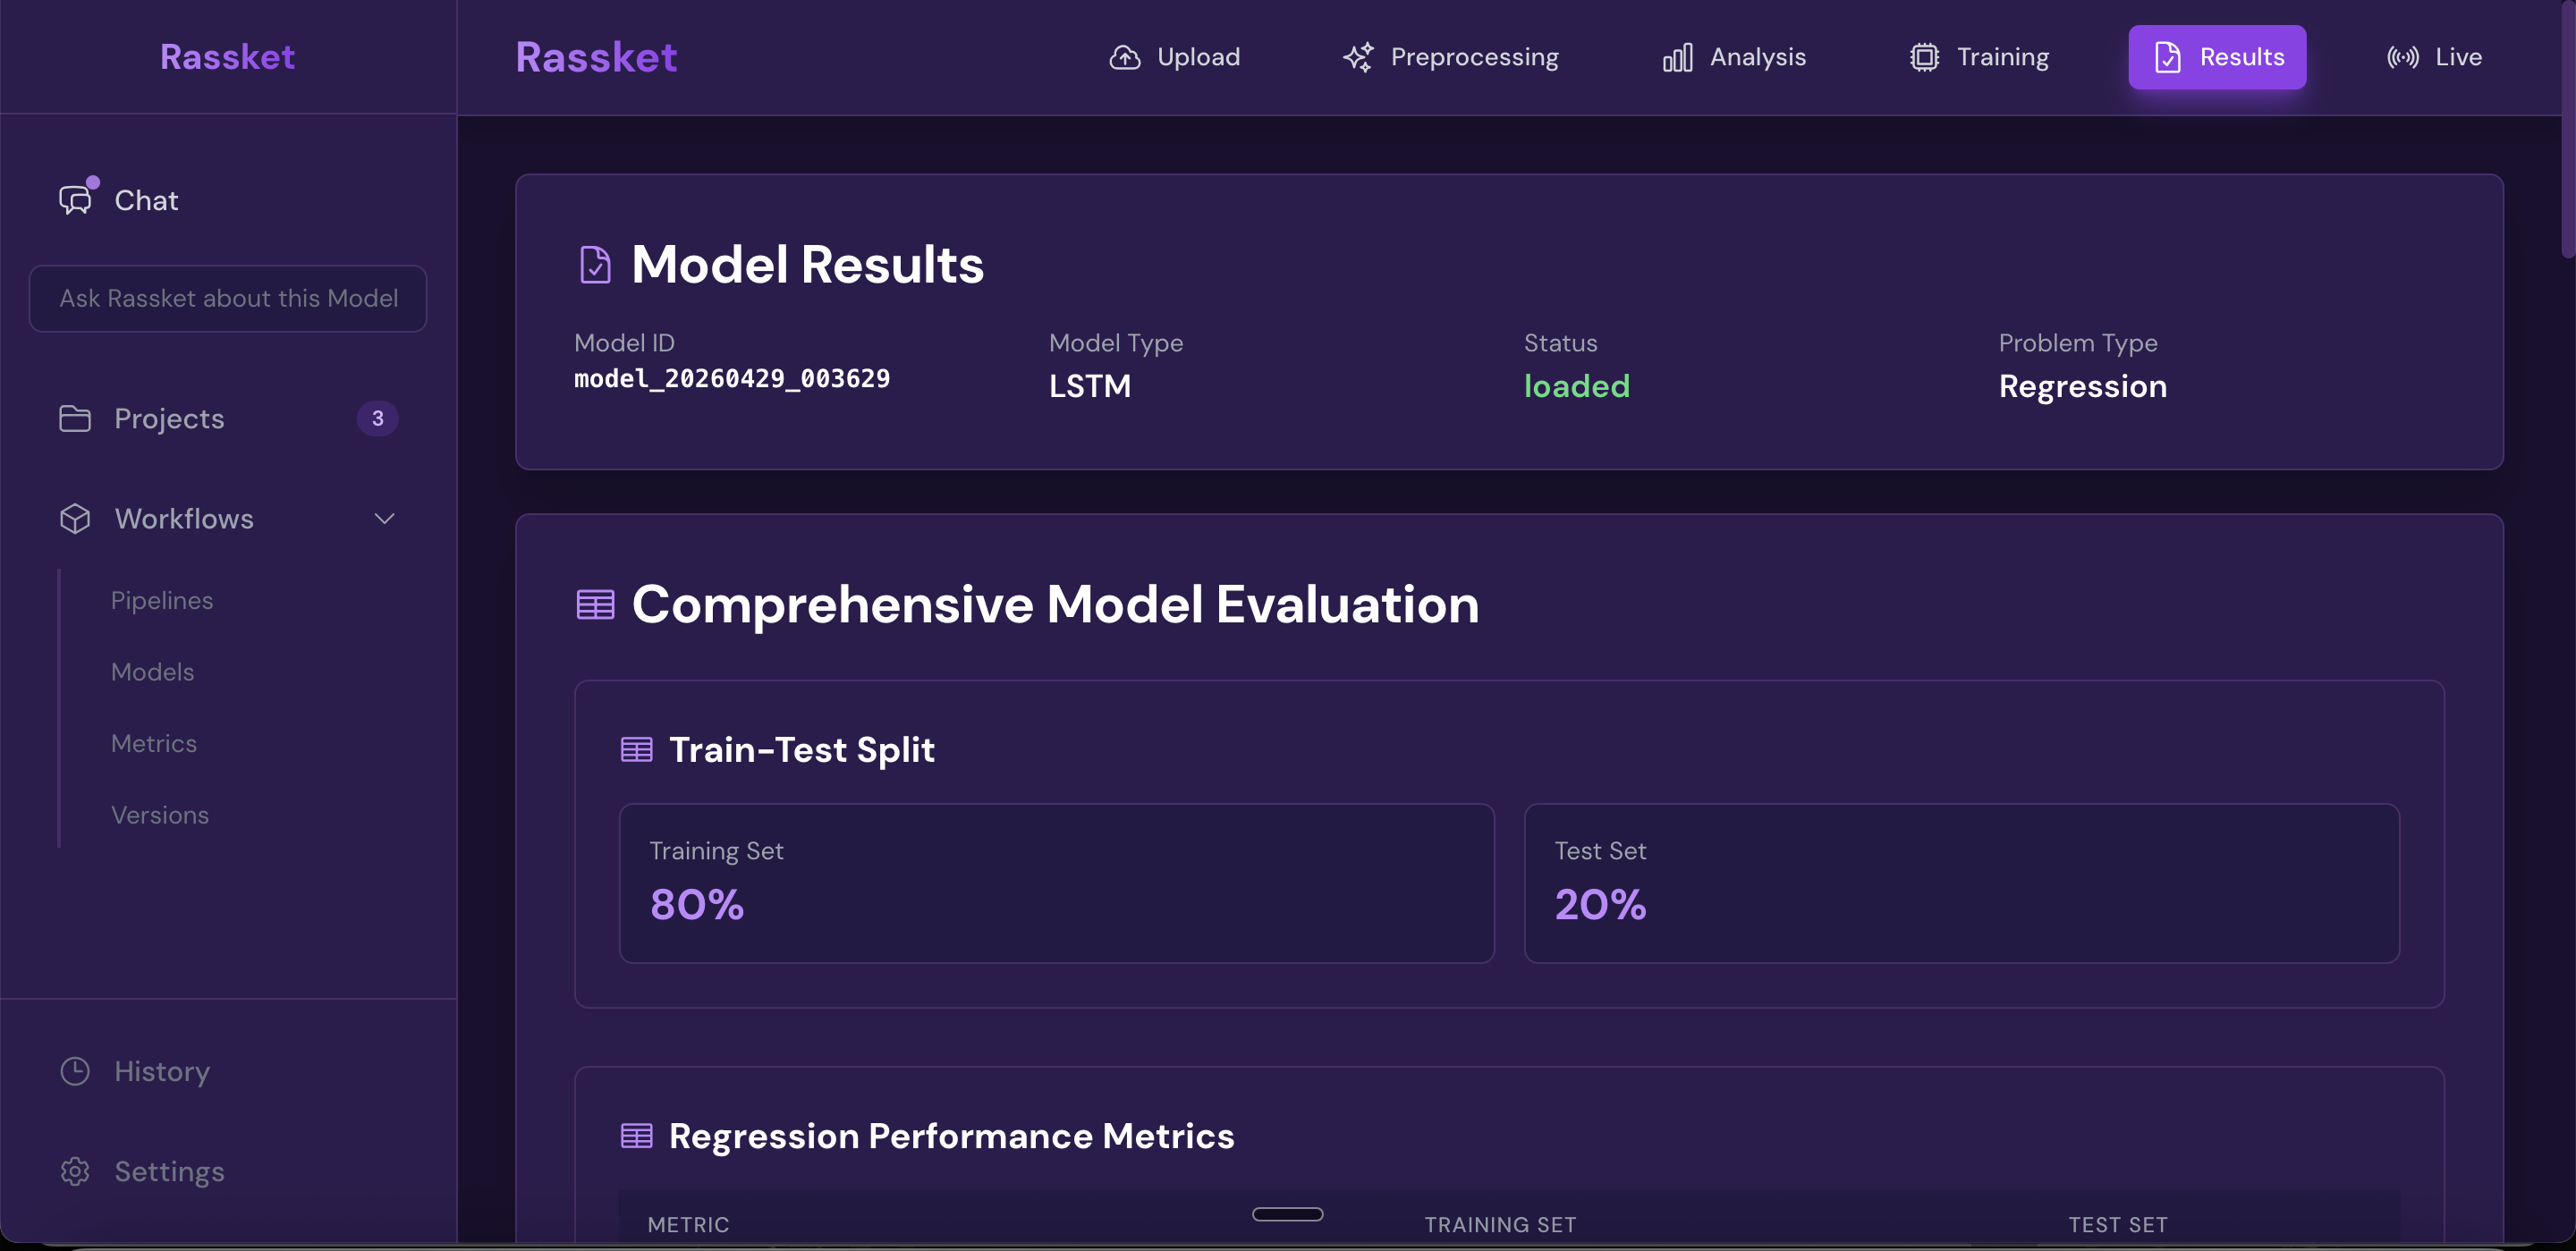
Train and validation results shown side by side — Rassket checks for overfitting automatically.
Step 5 — Insights & Action
What does this do?
After training, Rassket delivers the results in a format you can read, share, and act on. This includes forecast curves, plain-English explanations of what drives the forecast, and export options for your workflows.
Why does it matter?
A forecast number without context is not useful. Rassket tells you not just what the model predicts, but why — and gives you the confidence intervals and feature explanations you need to trust and communicate those predictions.
What you get
- Forecast curves with upper and lower confidence intervals
- Feature importance explained in plain English — which inputs matter most and why
- Natural language queries — ask questions about your data in plain English, no SQL required
- Decision simulations — run what-if scenarios using chat-based interaction
- Export formats: PDF report, CSV data export, and API access
Get forecast curves, plain-English explanations, and export-ready results.
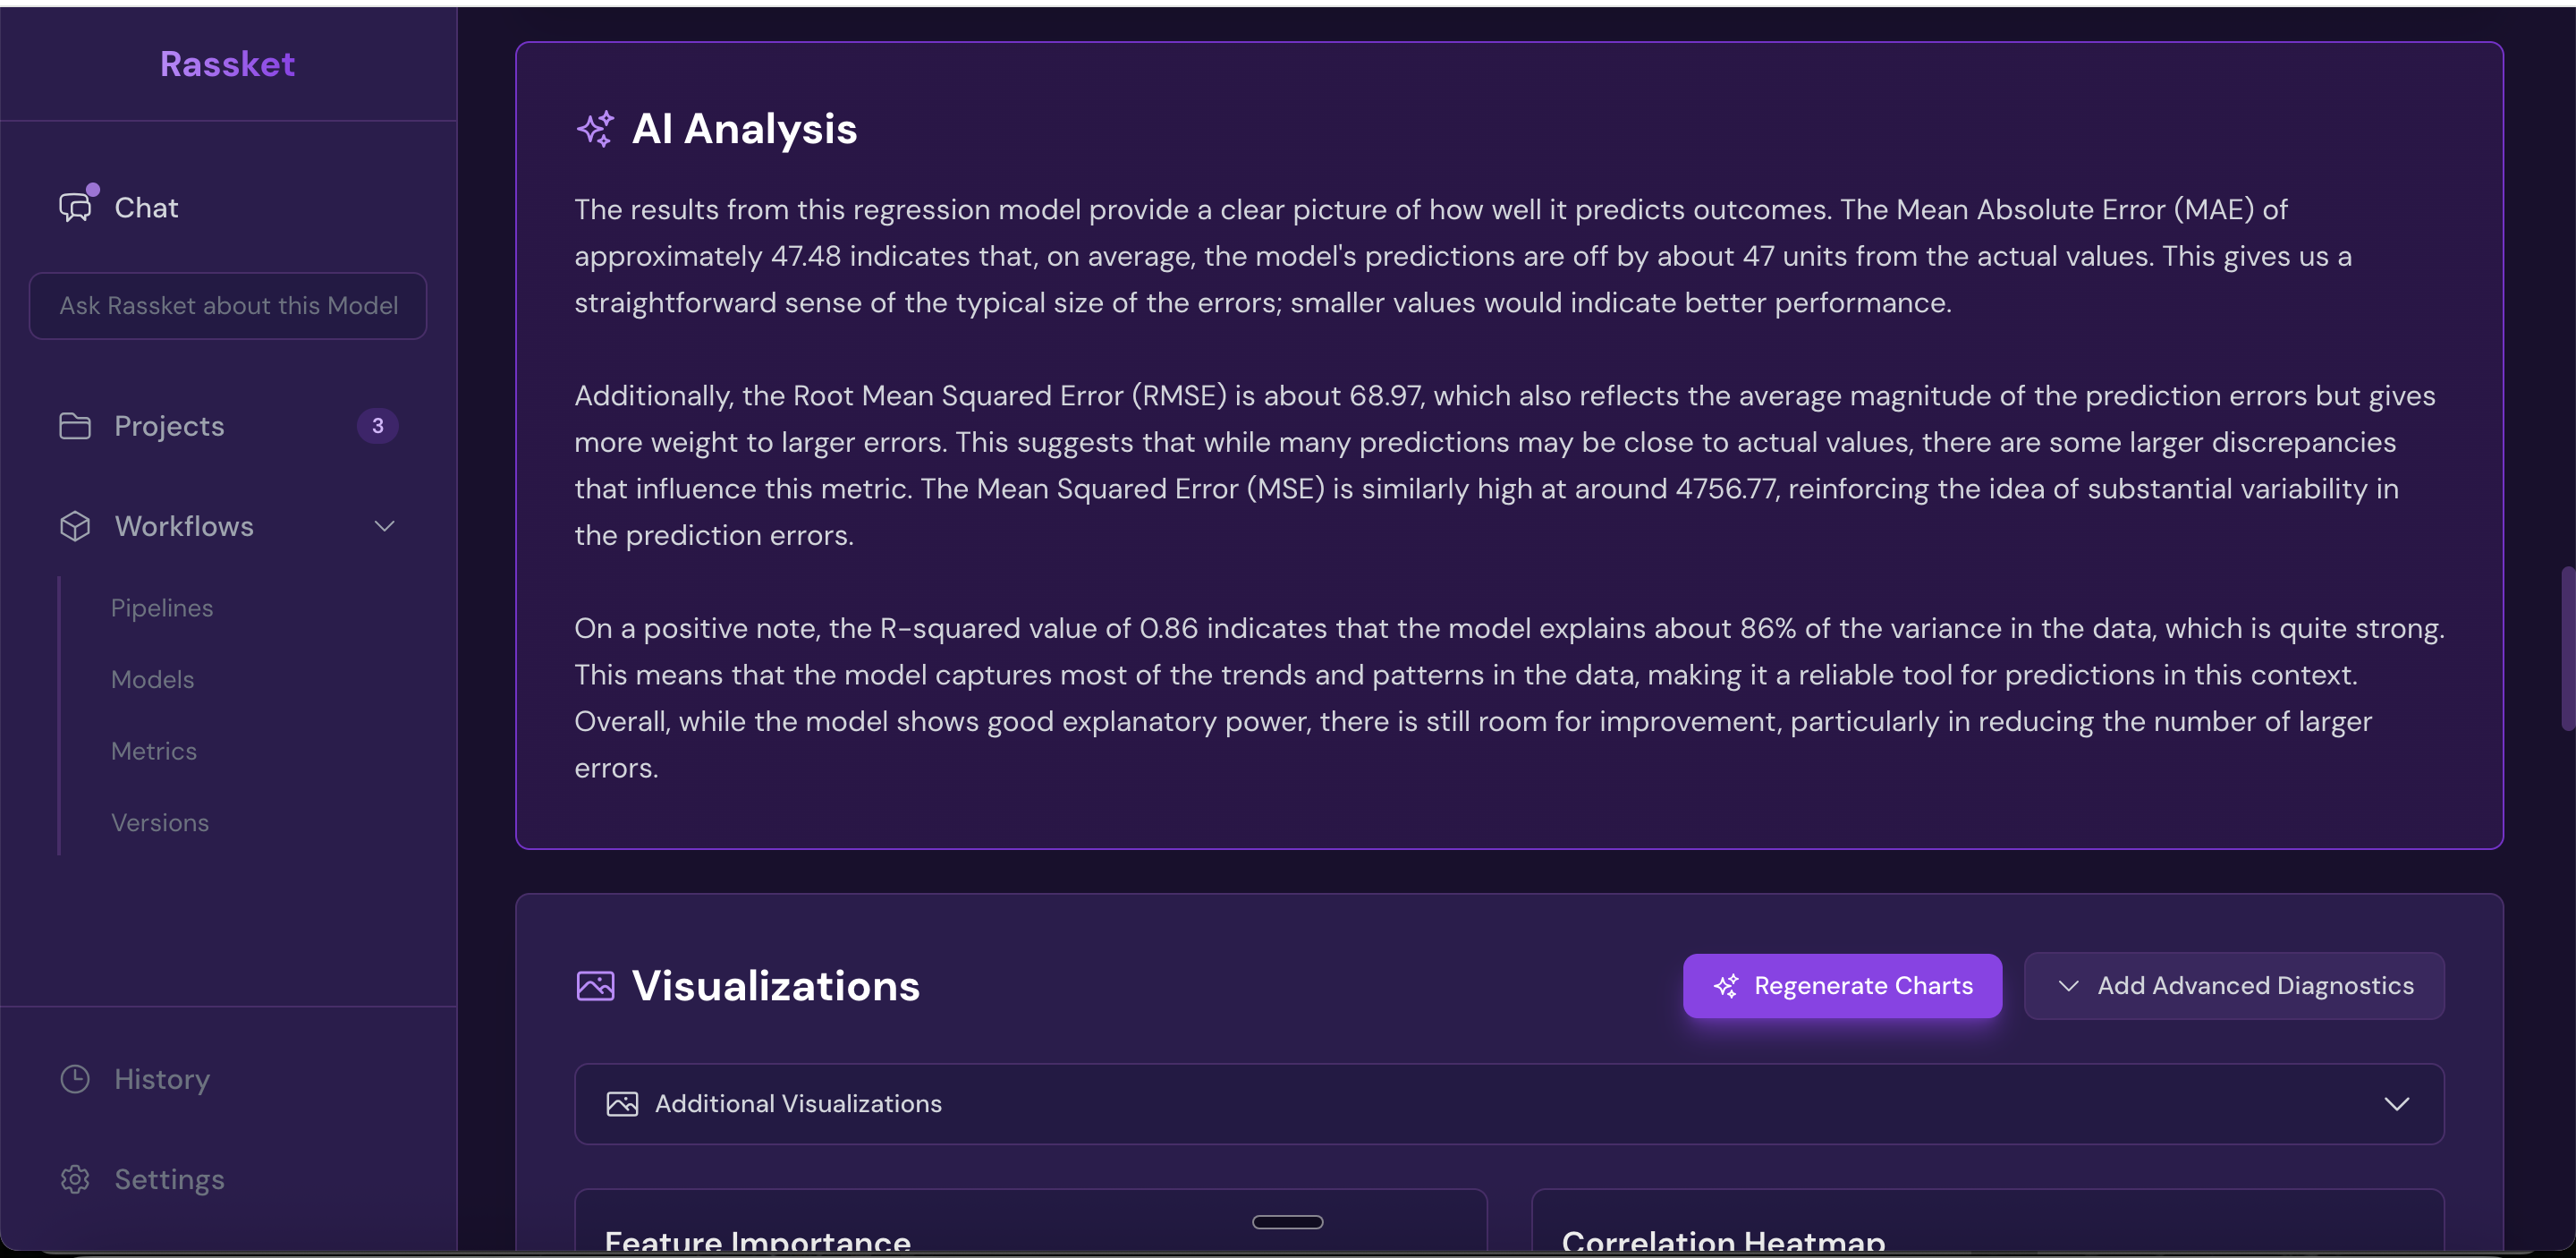
Full model analysis results — accuracy metrics, error breakdown, and performance by time period.
Feature extraction — Rassket shows which inputs drive your forecast in plain English.
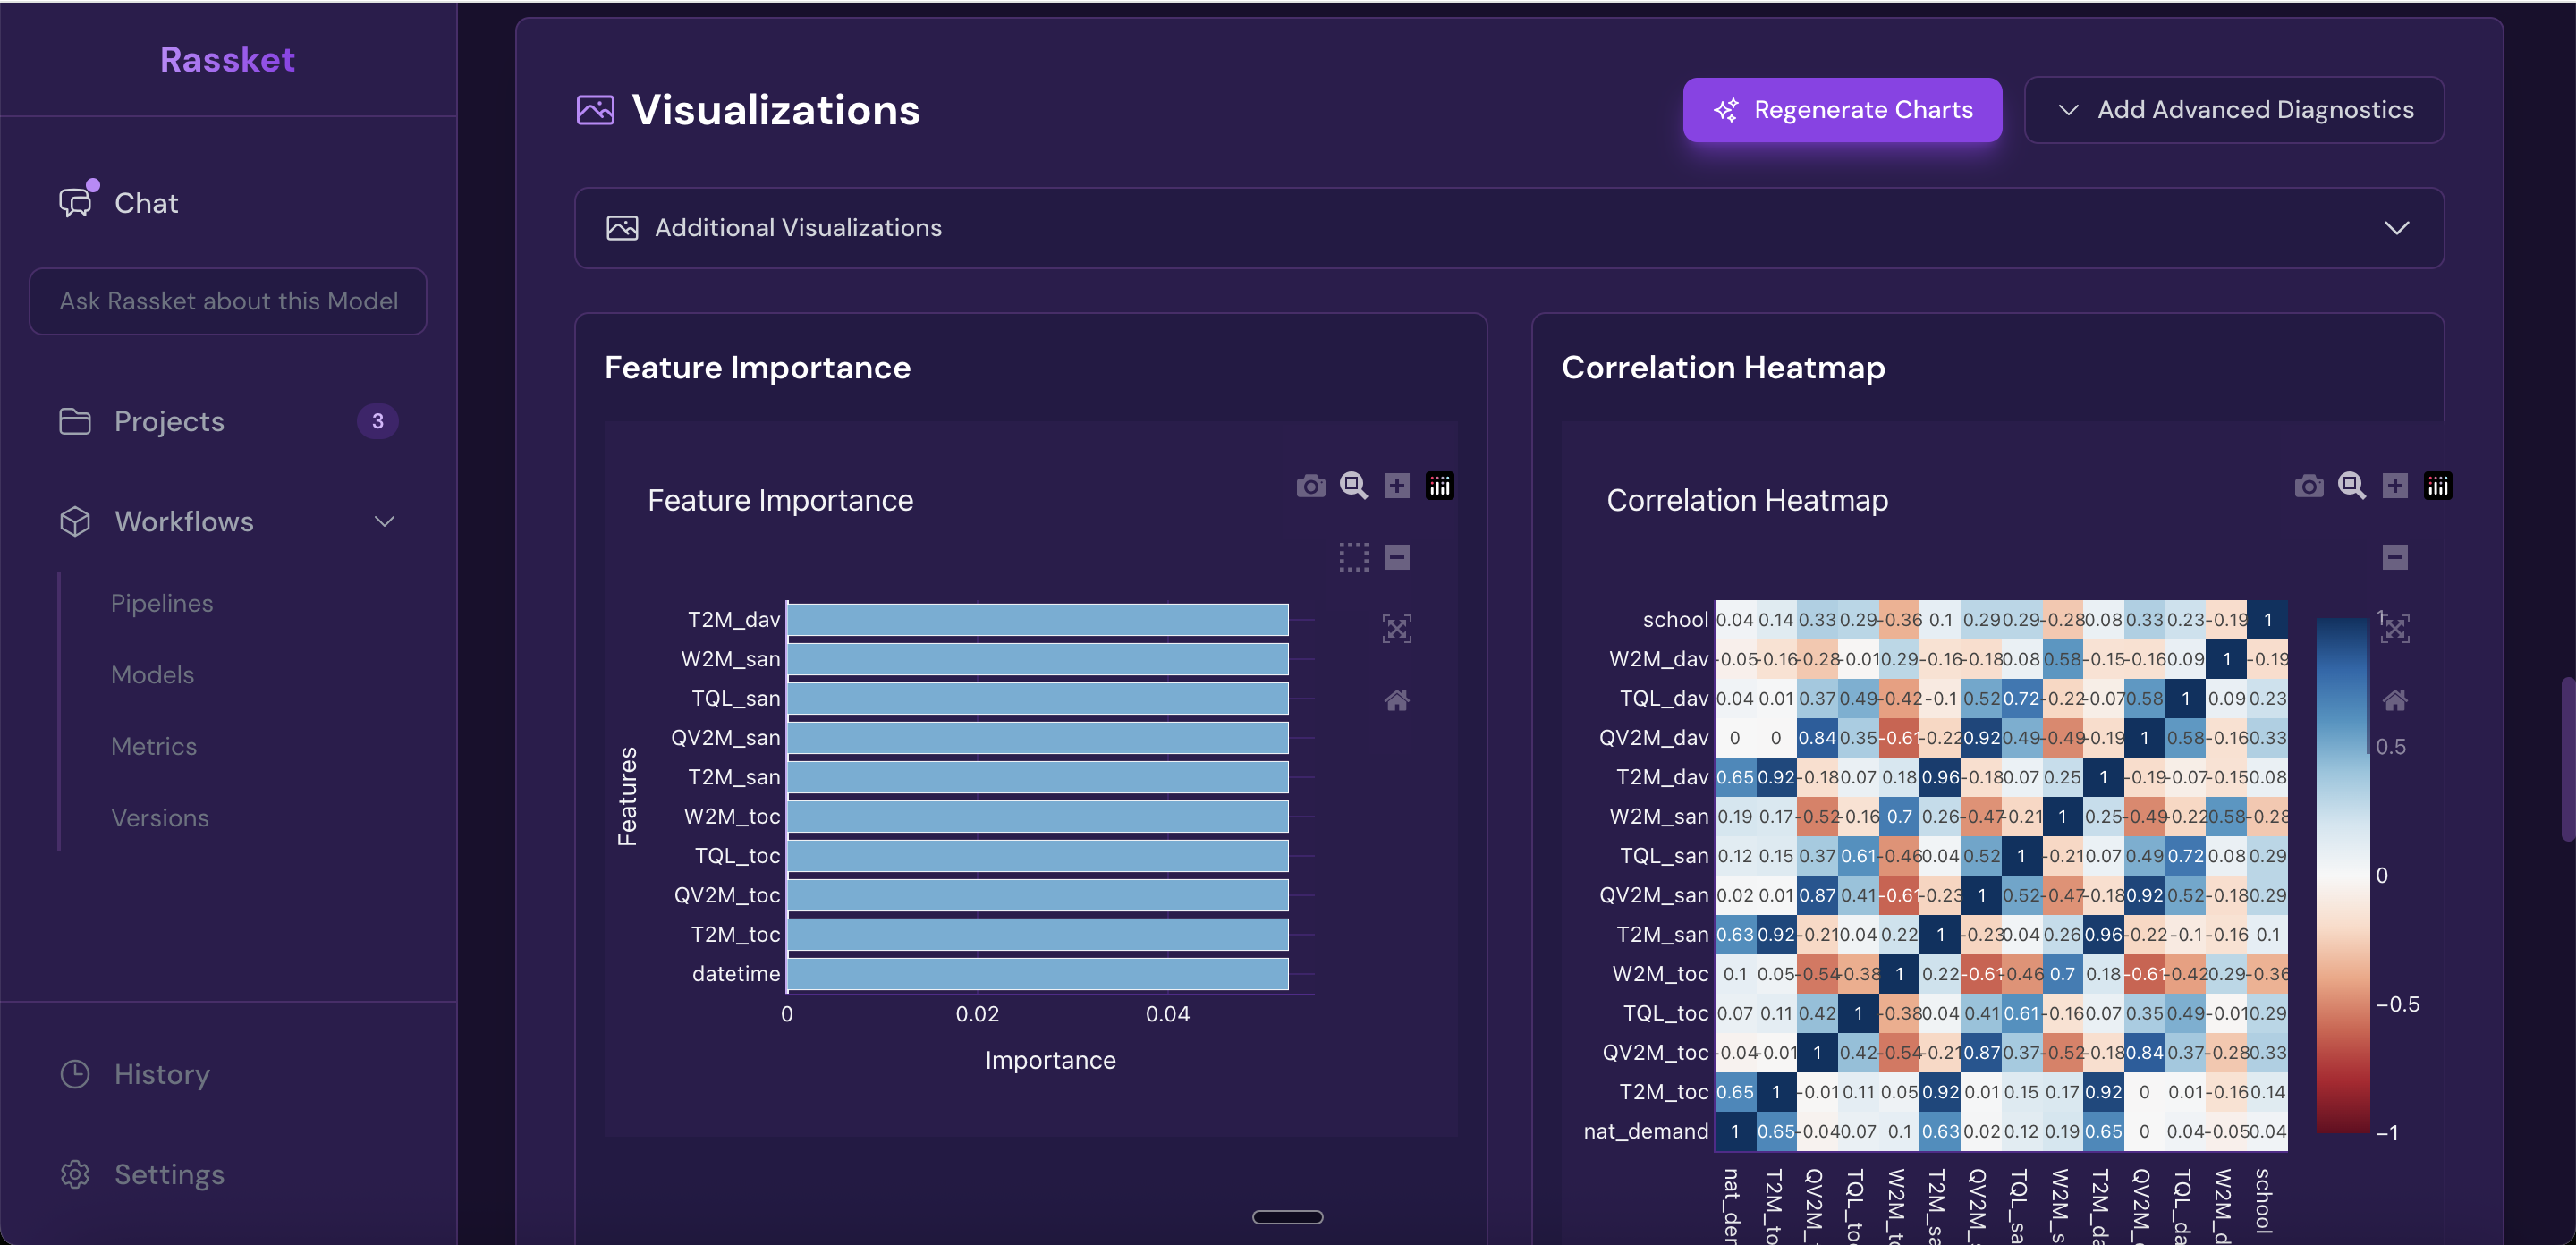
Heatmap and feature importance — understand how your input signals relate to each other and to the forecast.
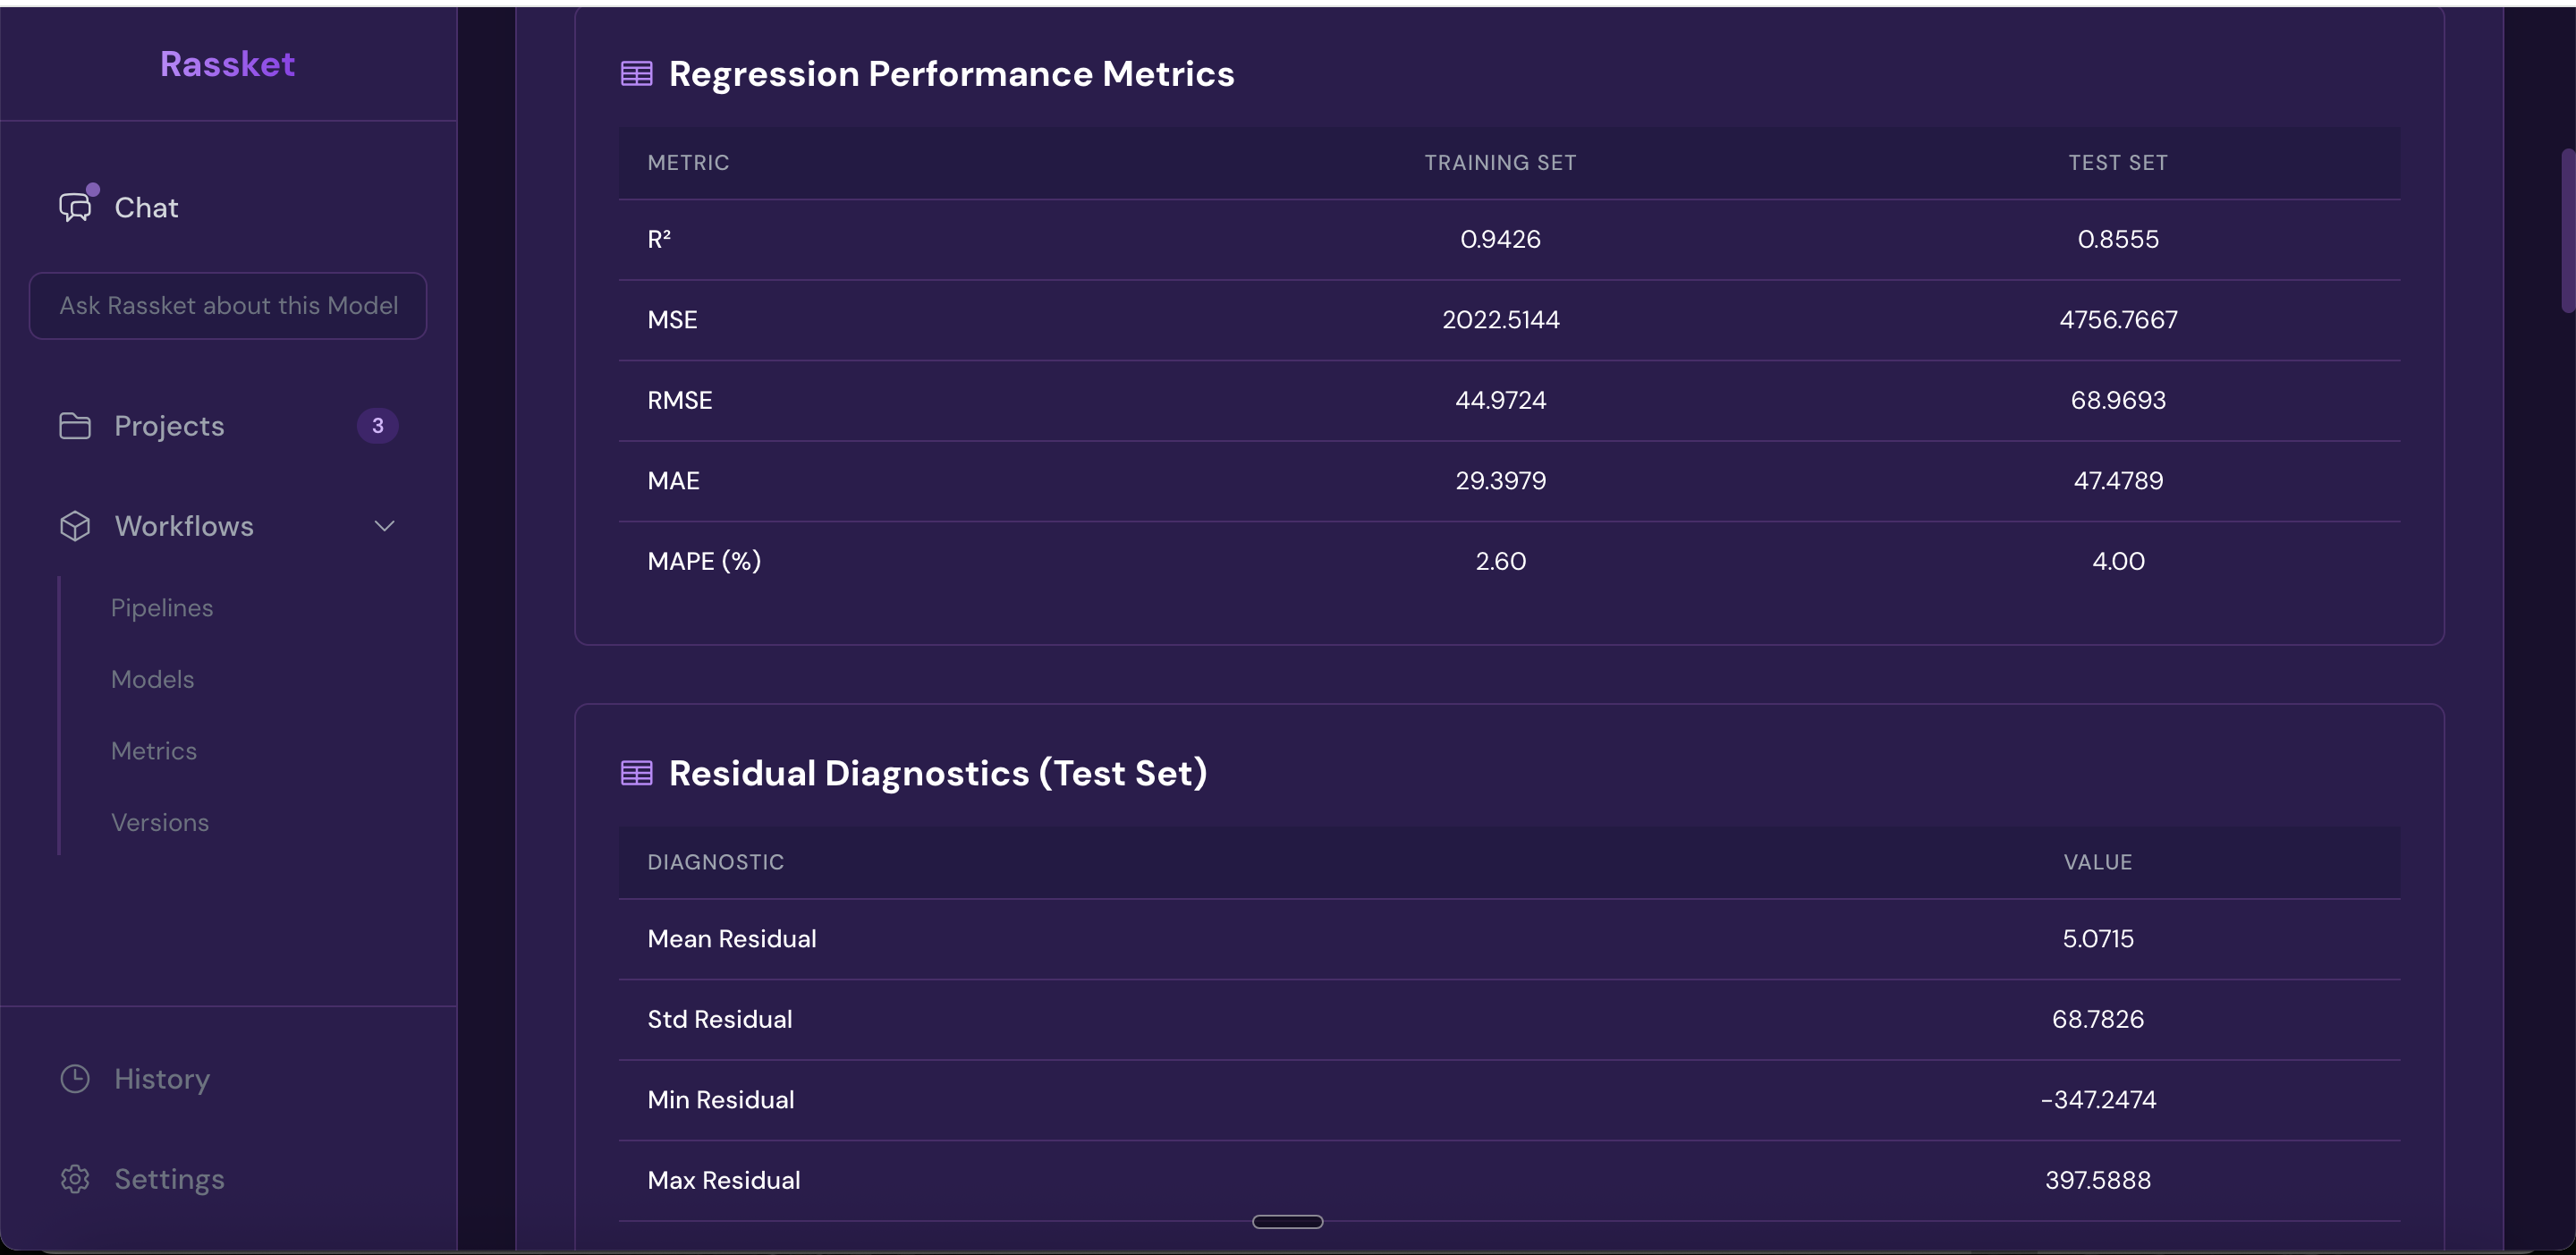
Full forecast accuracy metrics — RMSE, MAE, R-squared, and more shown in one view.
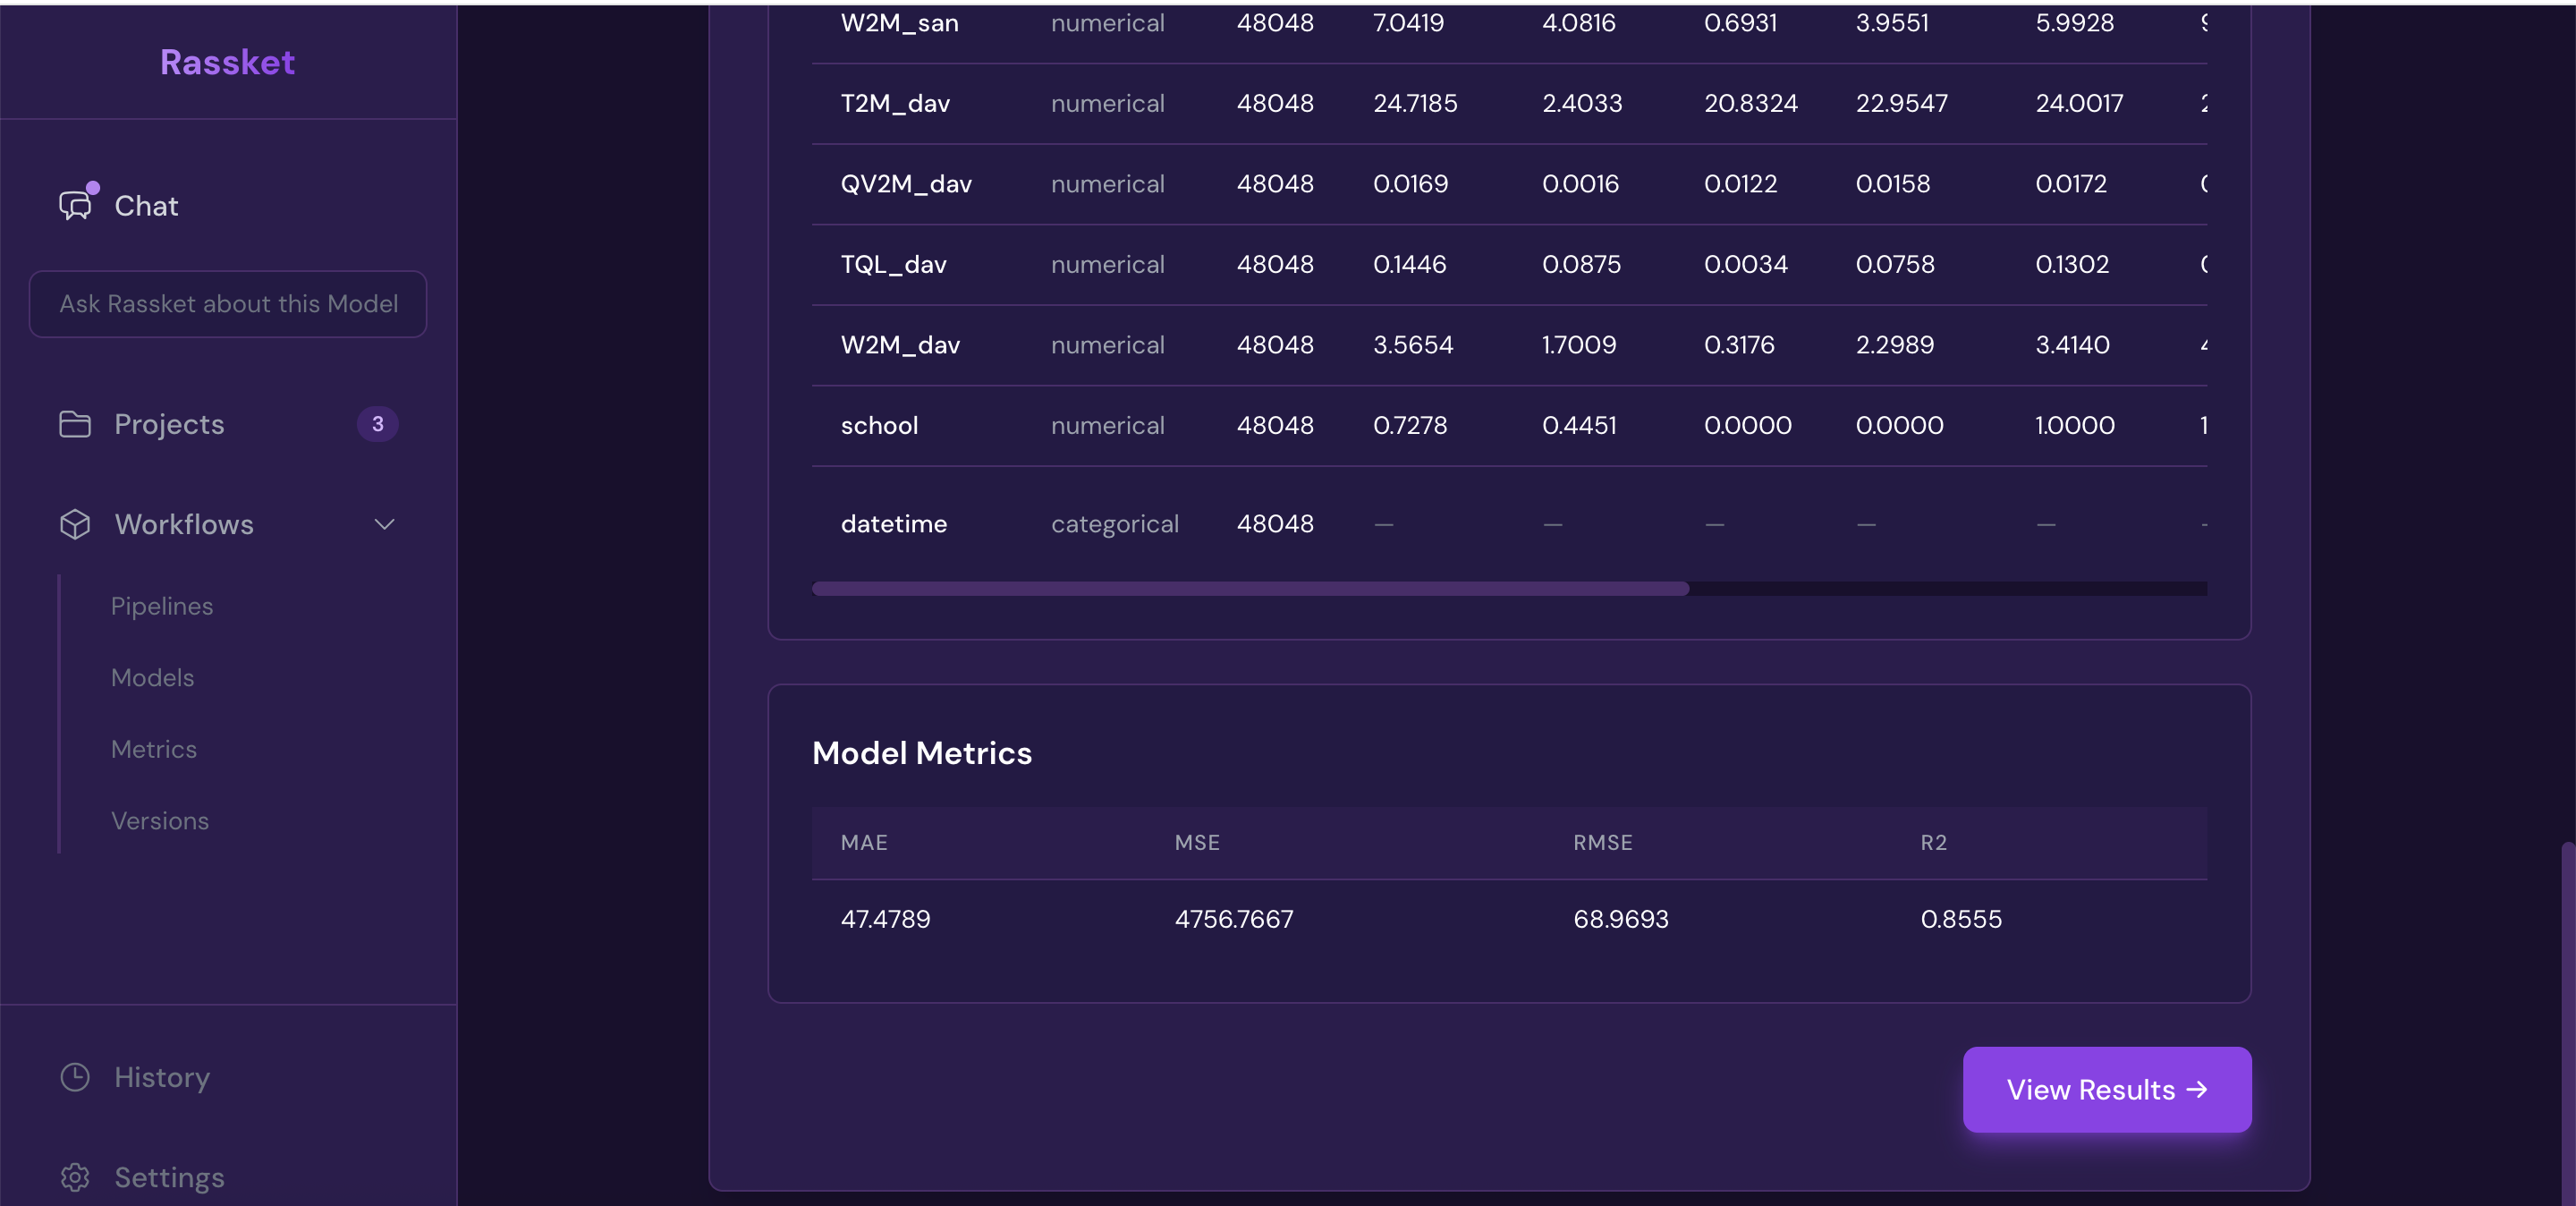
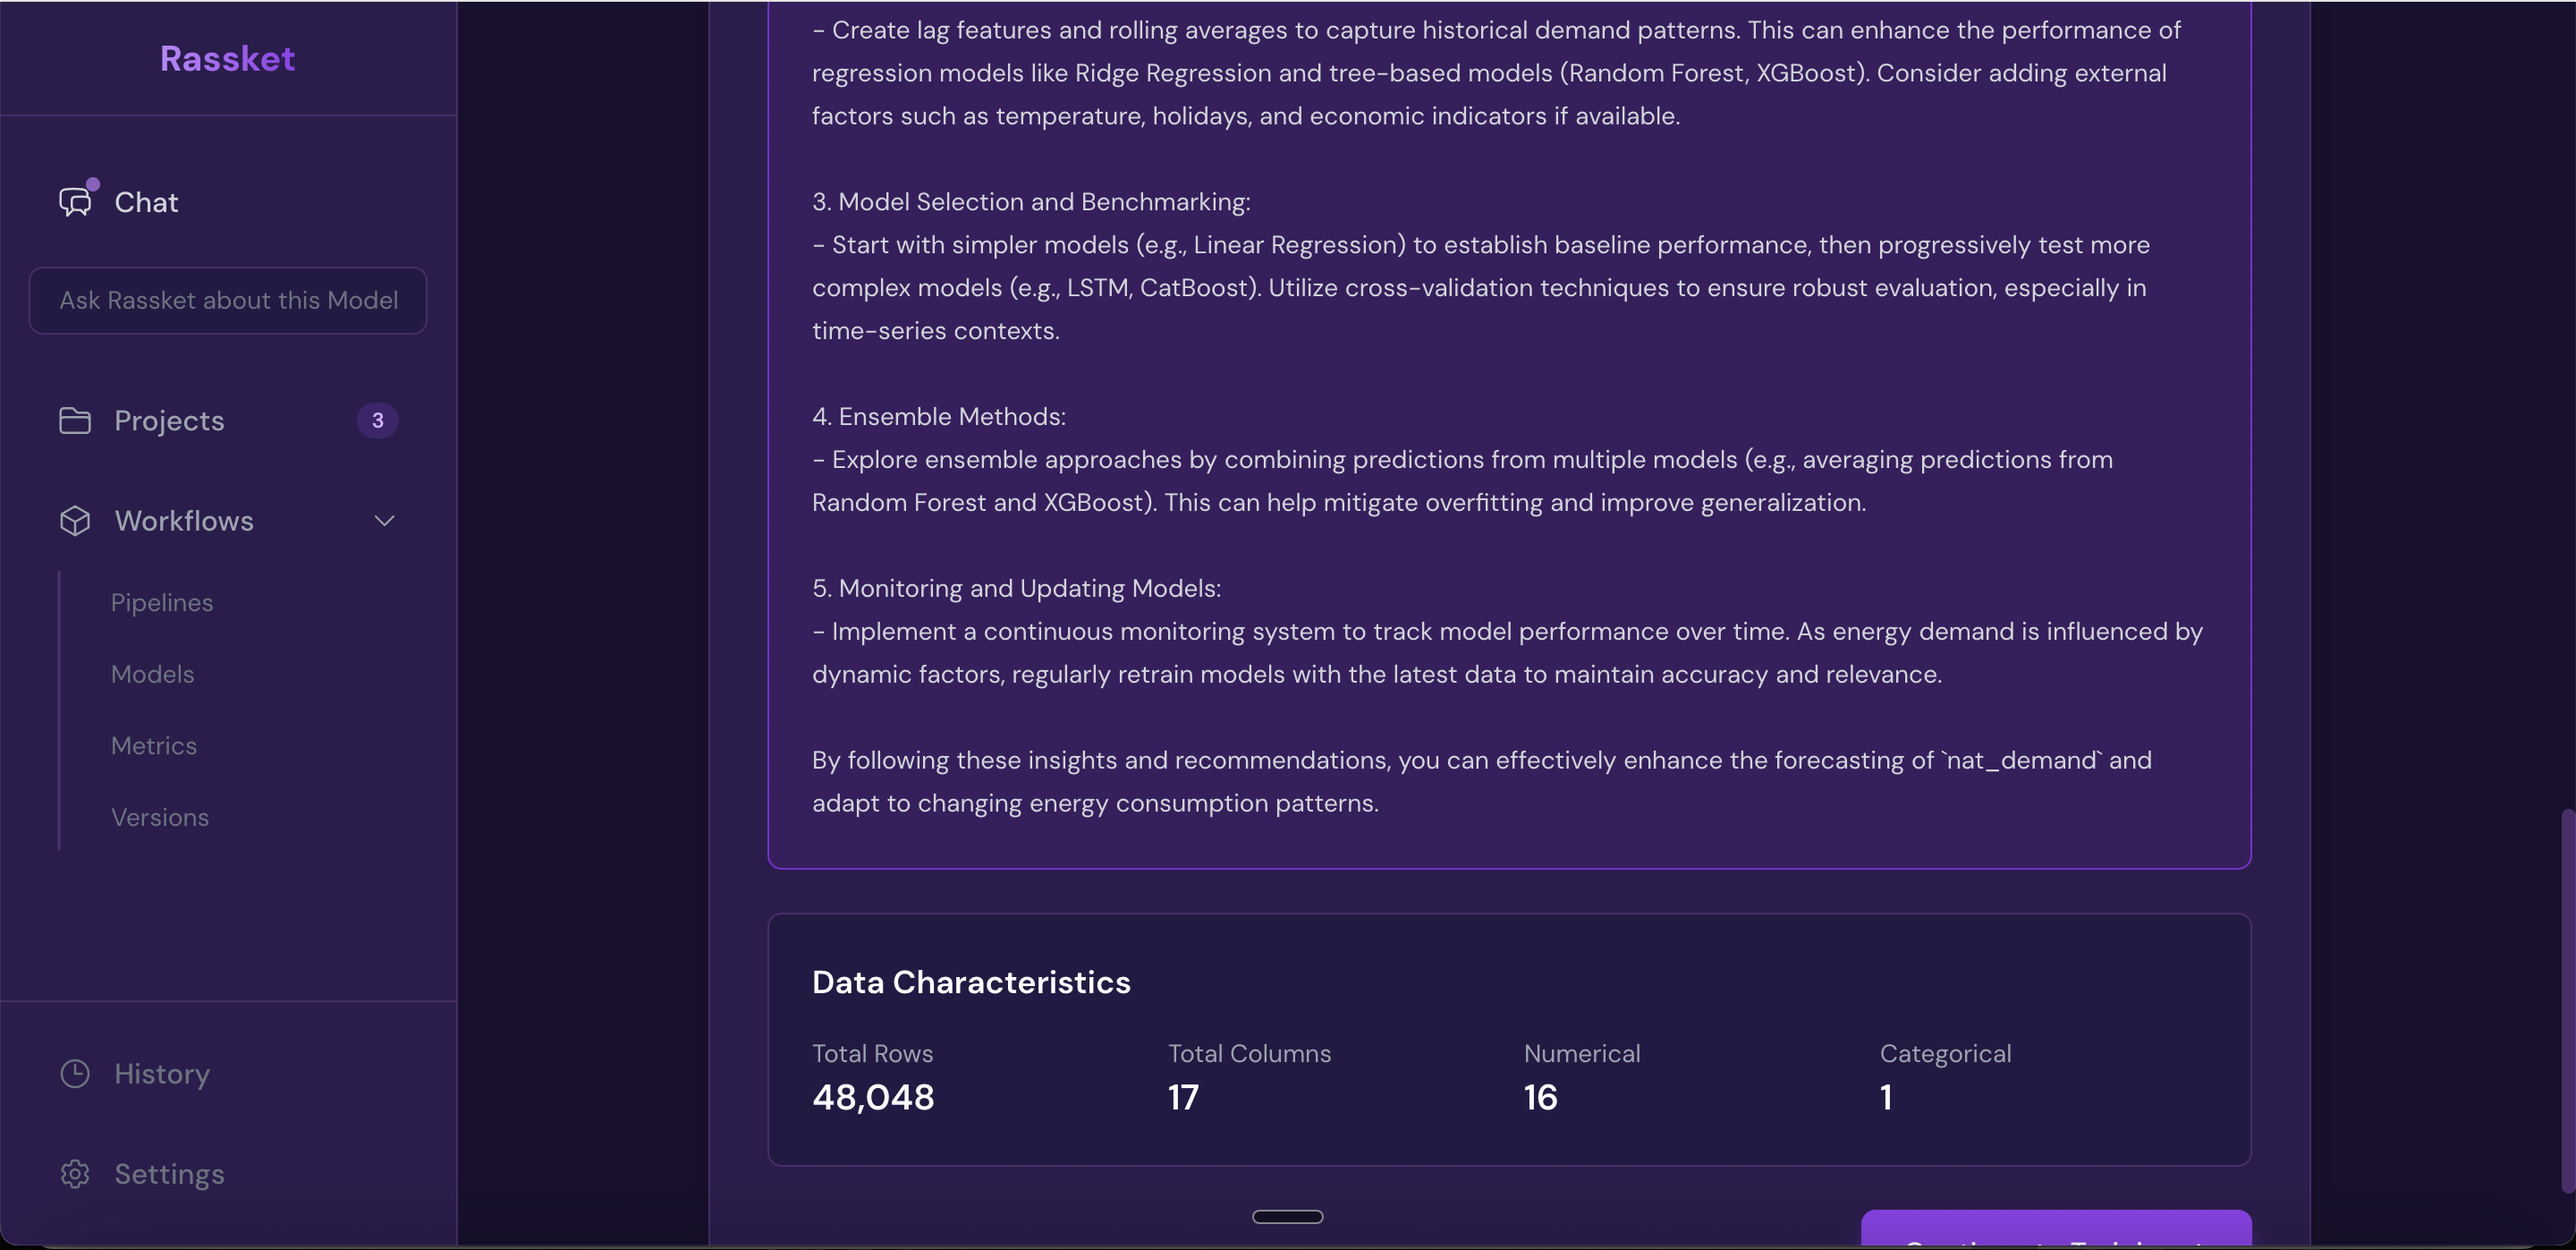
Summary statistics — a quick overview of your dataset and prediction model performance.
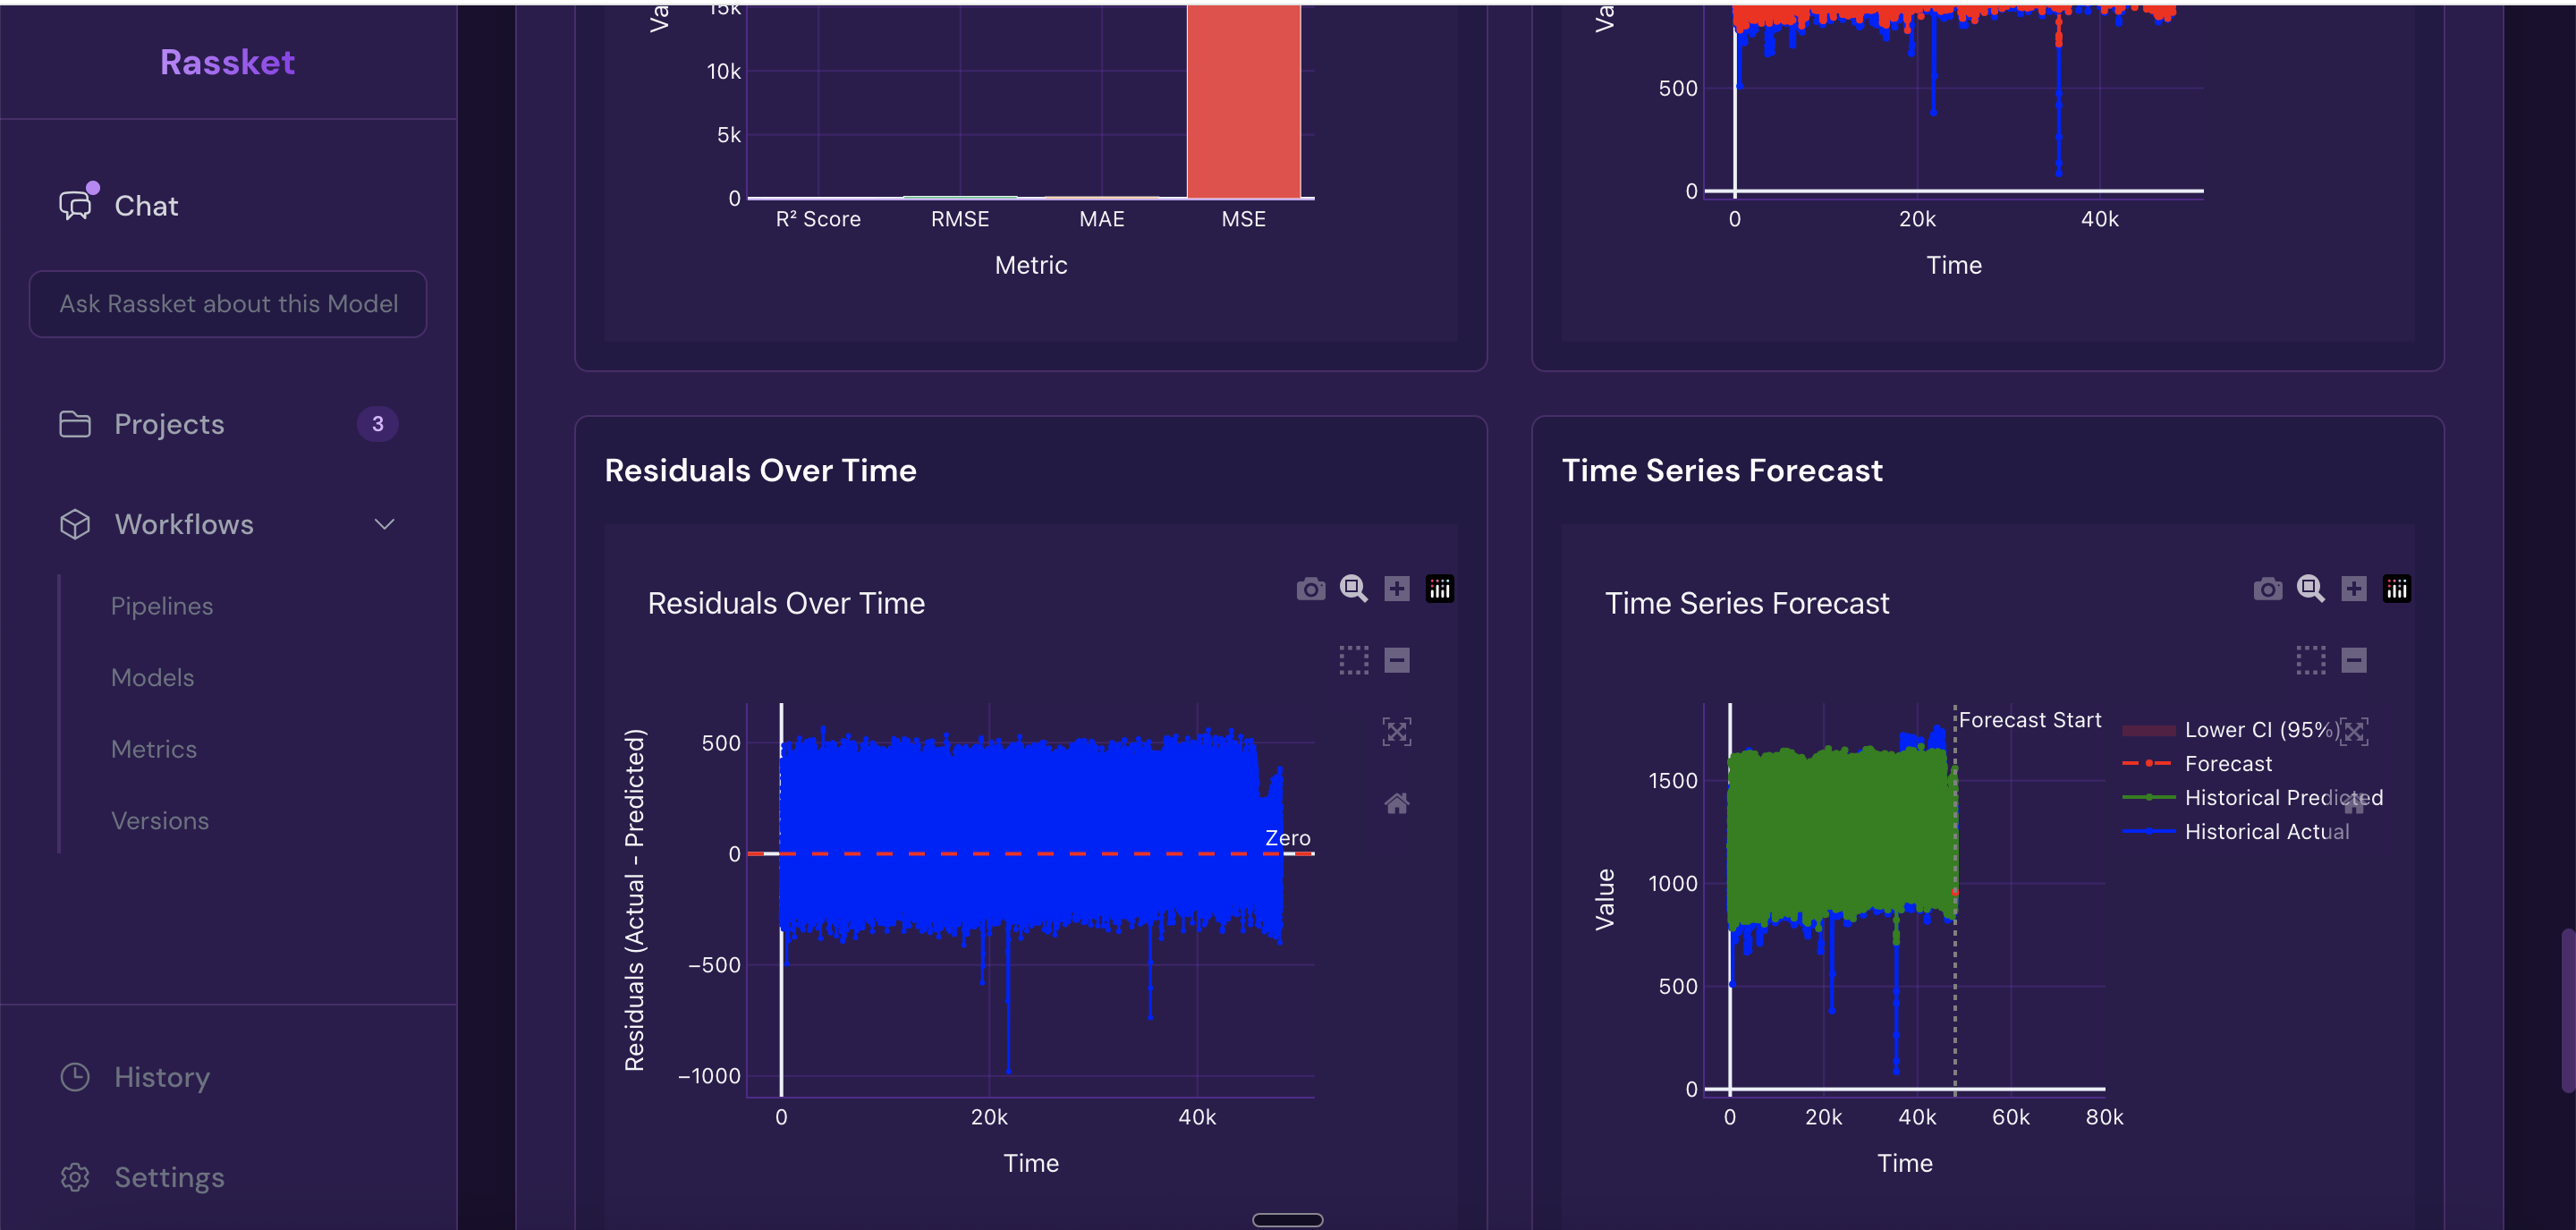
Time-series visualizations — actual vs forecast plotted over time with confidence bands.
Natural Language Queries
Once your model is trained, you can ask questions about your data and forecasts in plain English. No SQL or technical knowledge required.
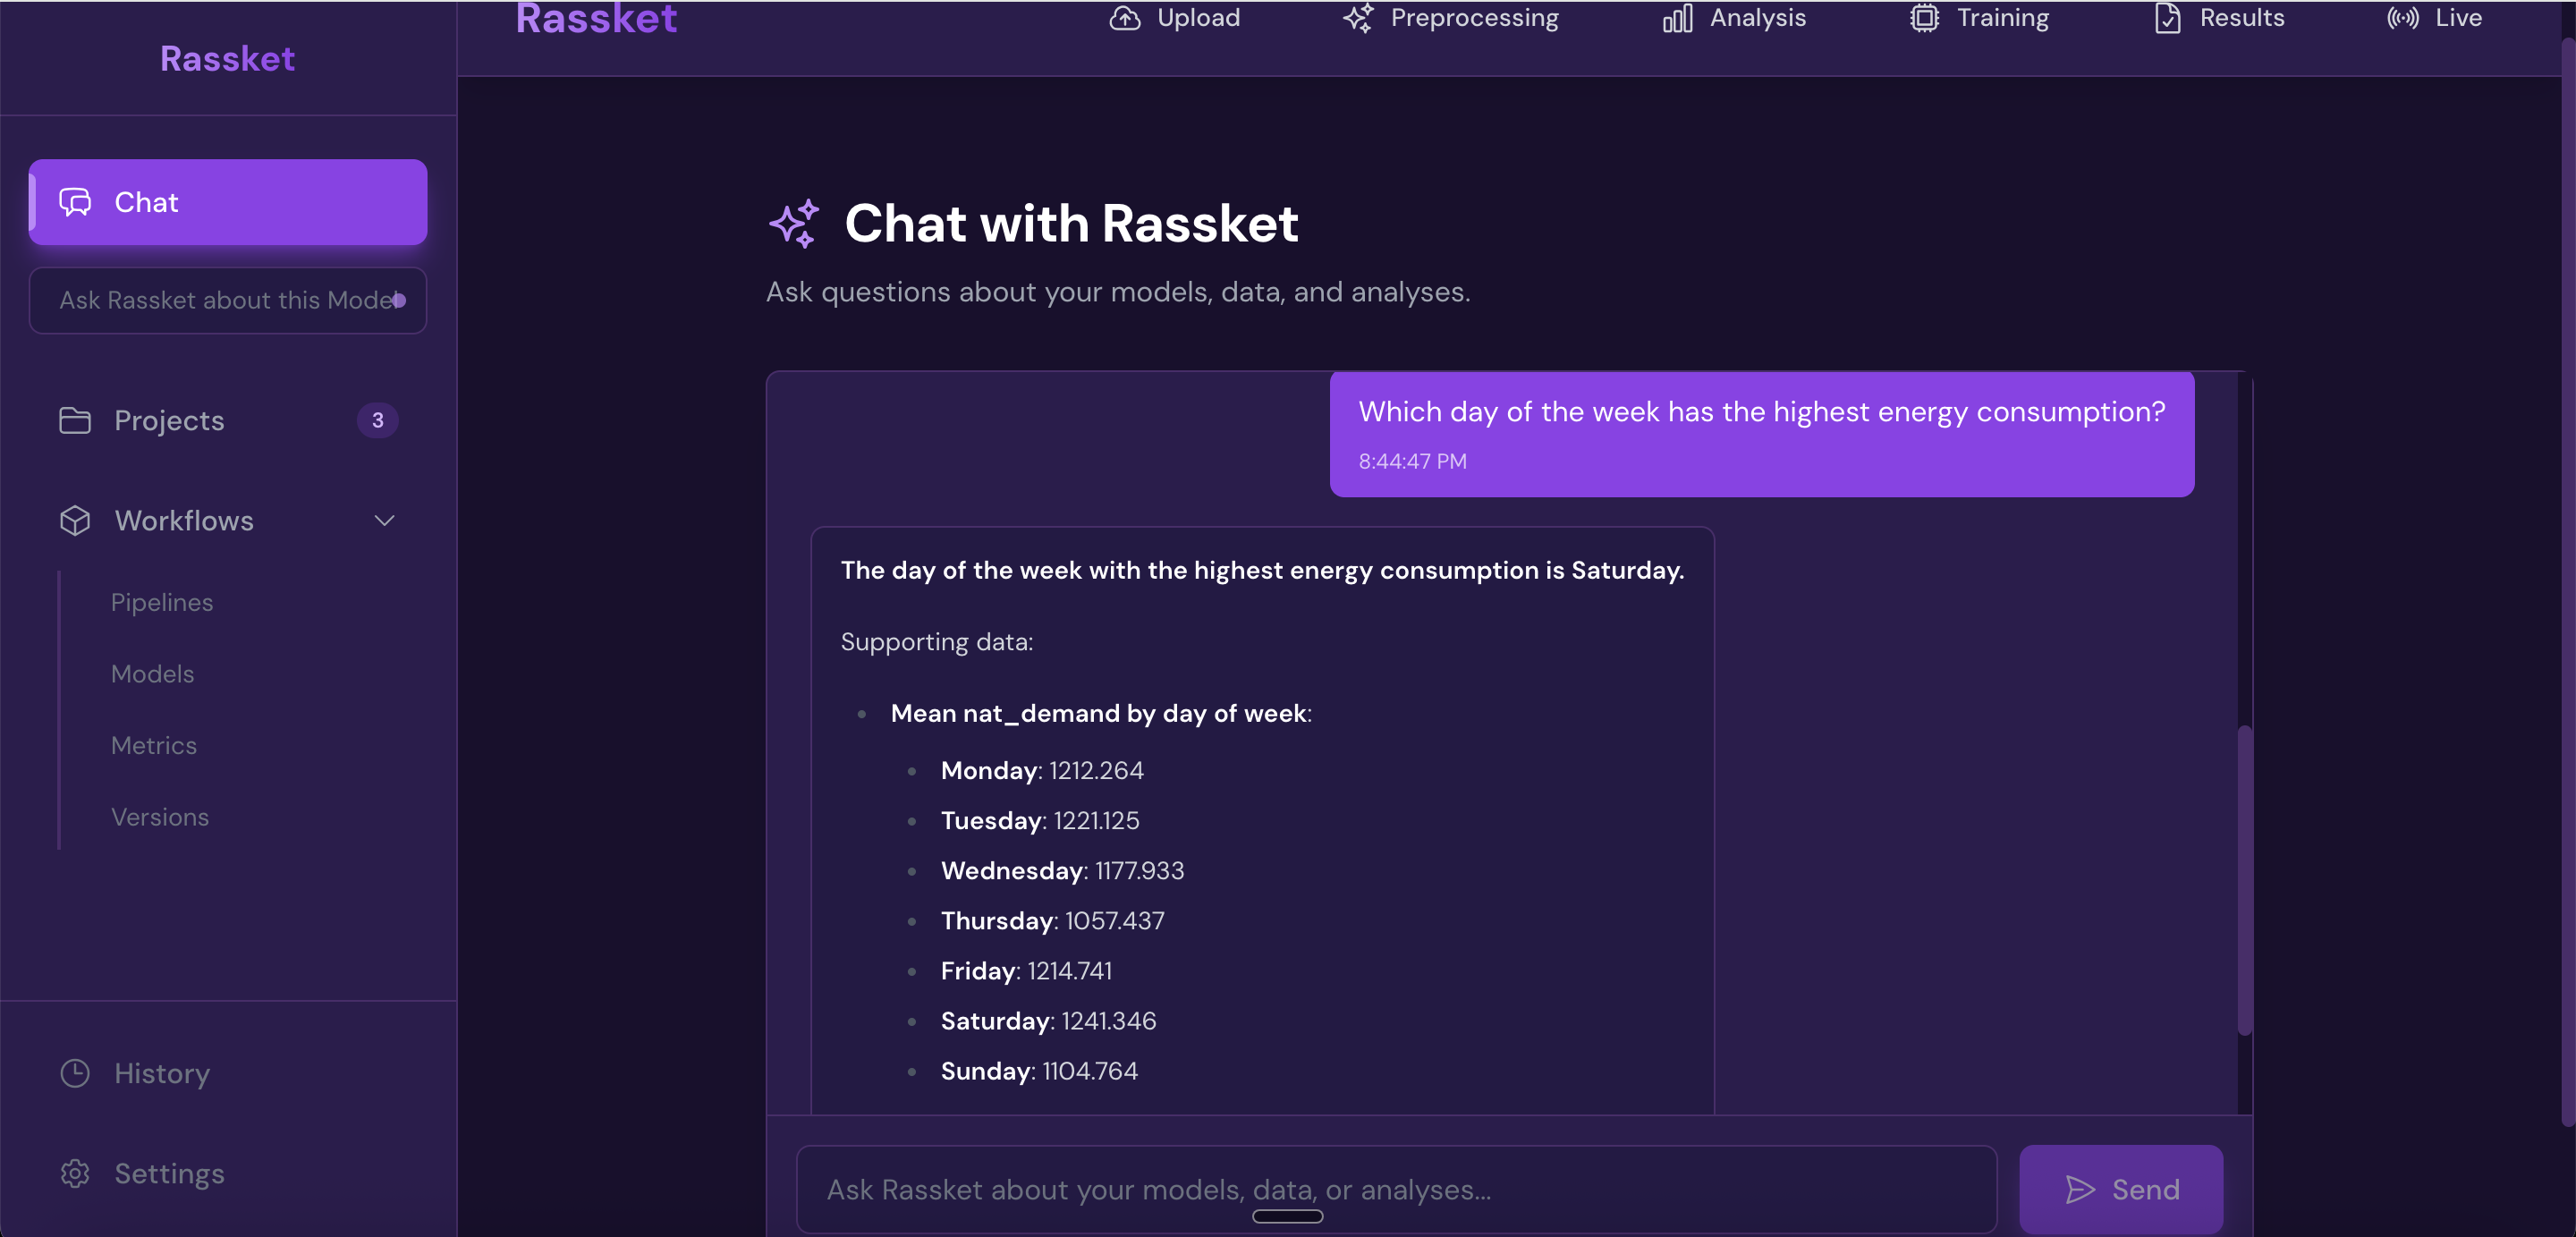
Ask your data questions in plain English — no SQL or technical knowledge required.
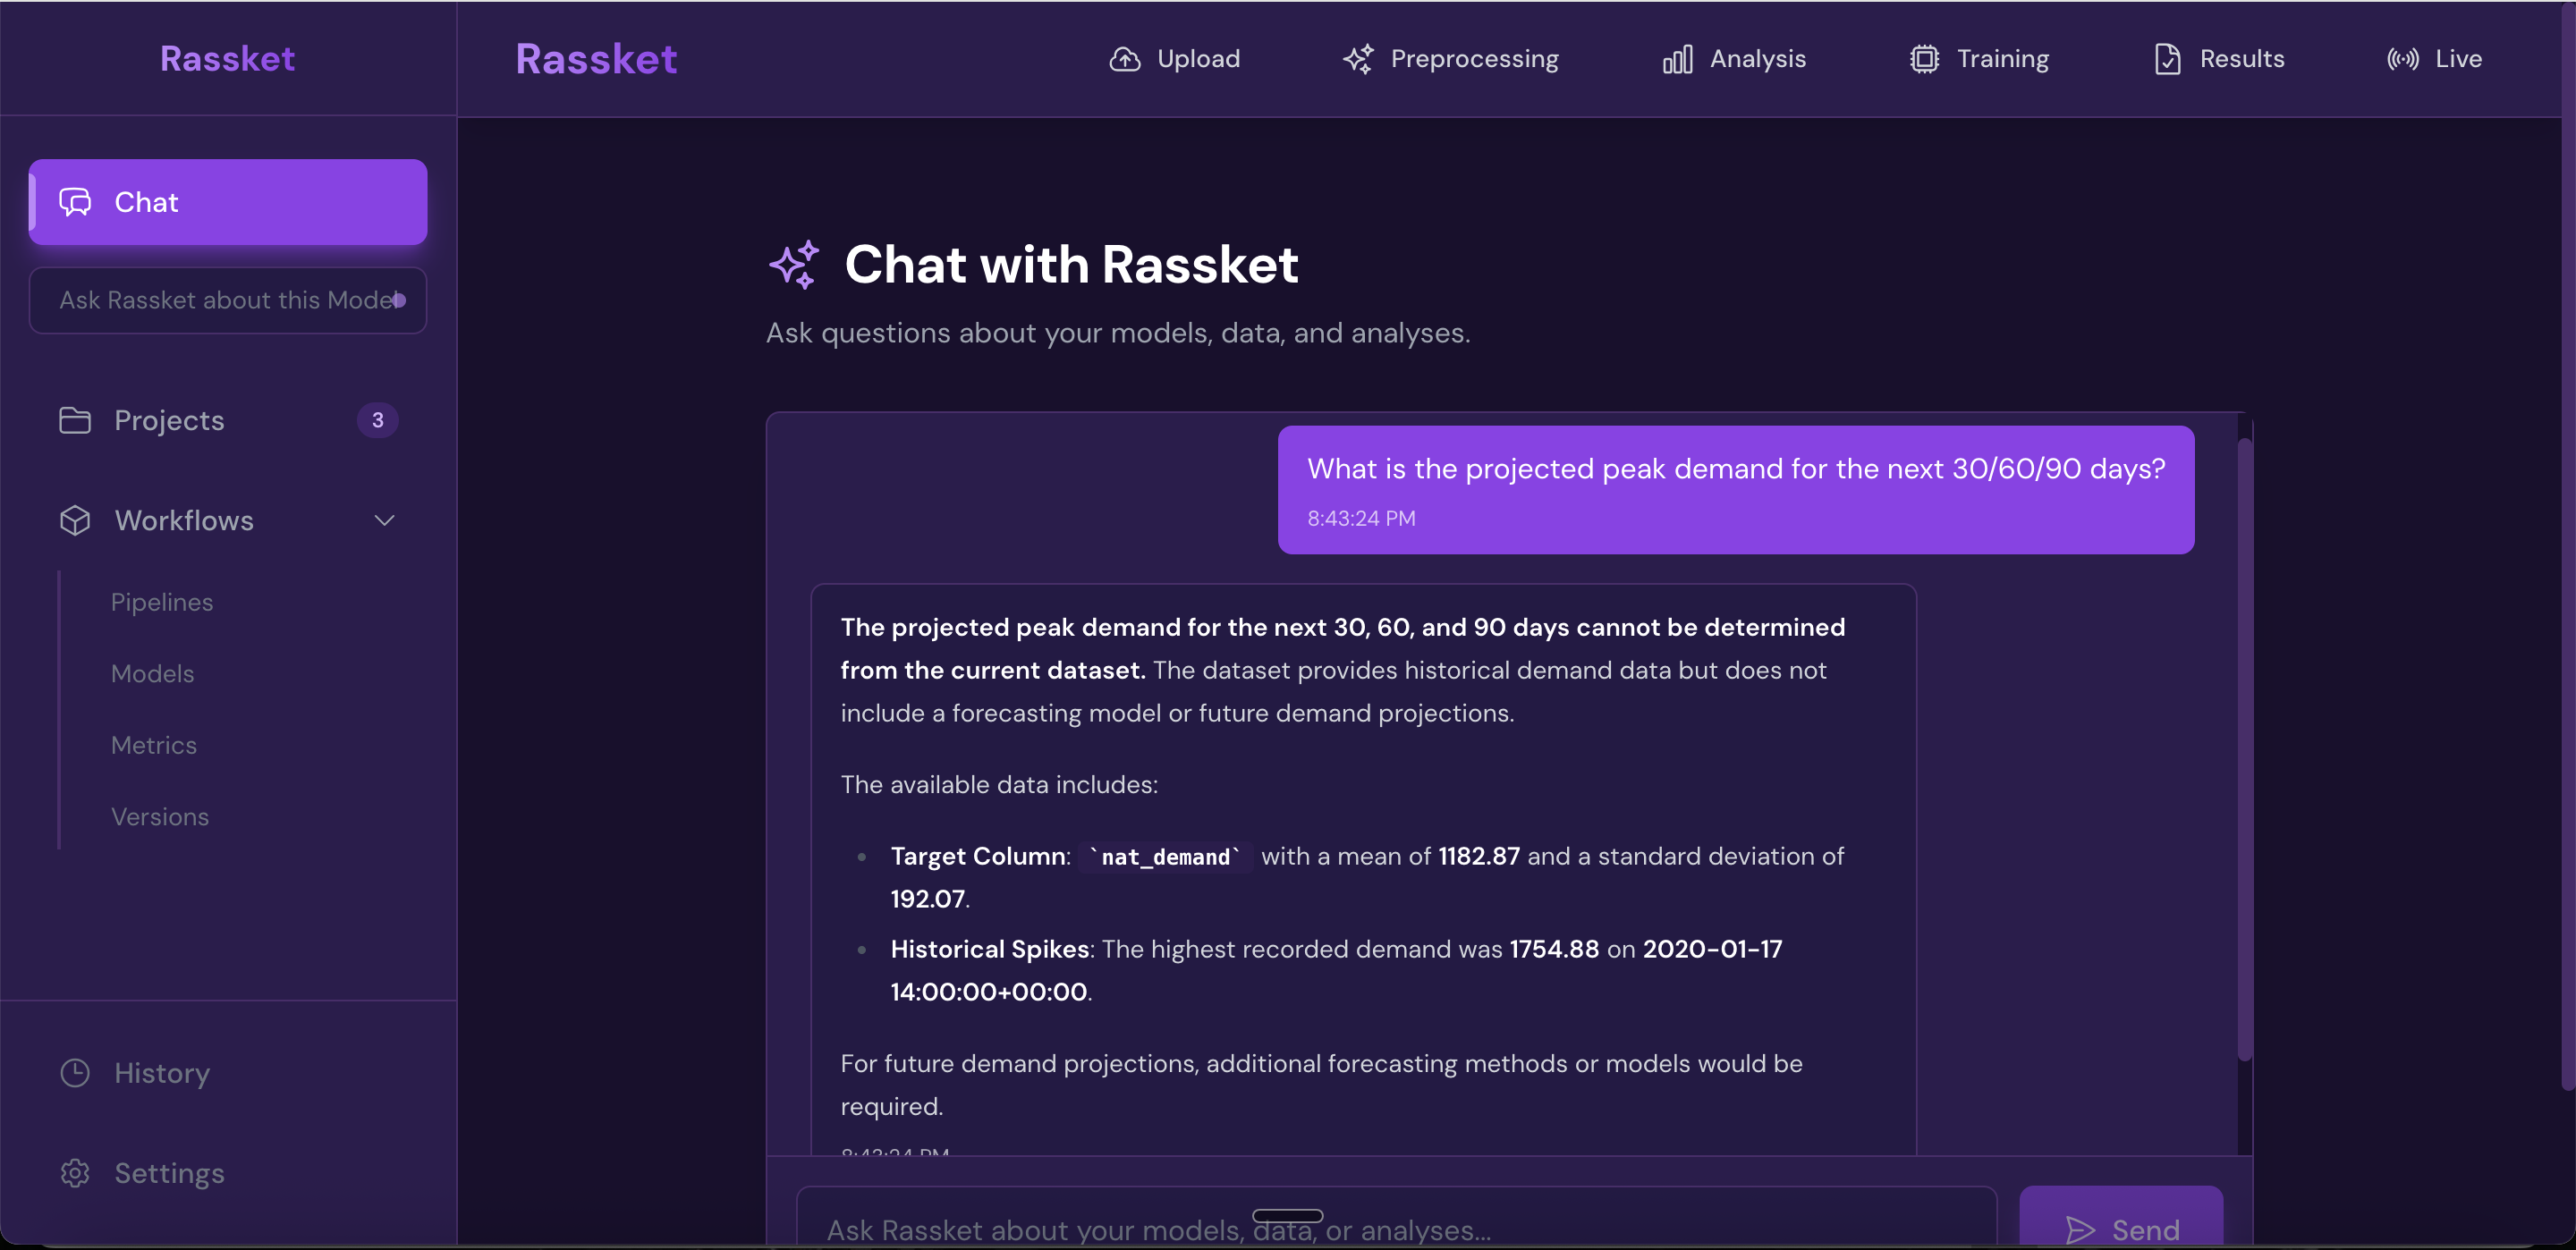
Decision simulations — run what-if scenarios and get plain-English answers grounded in your data.
Exporting Results
All results are exportable in the format that works best for your workflow.
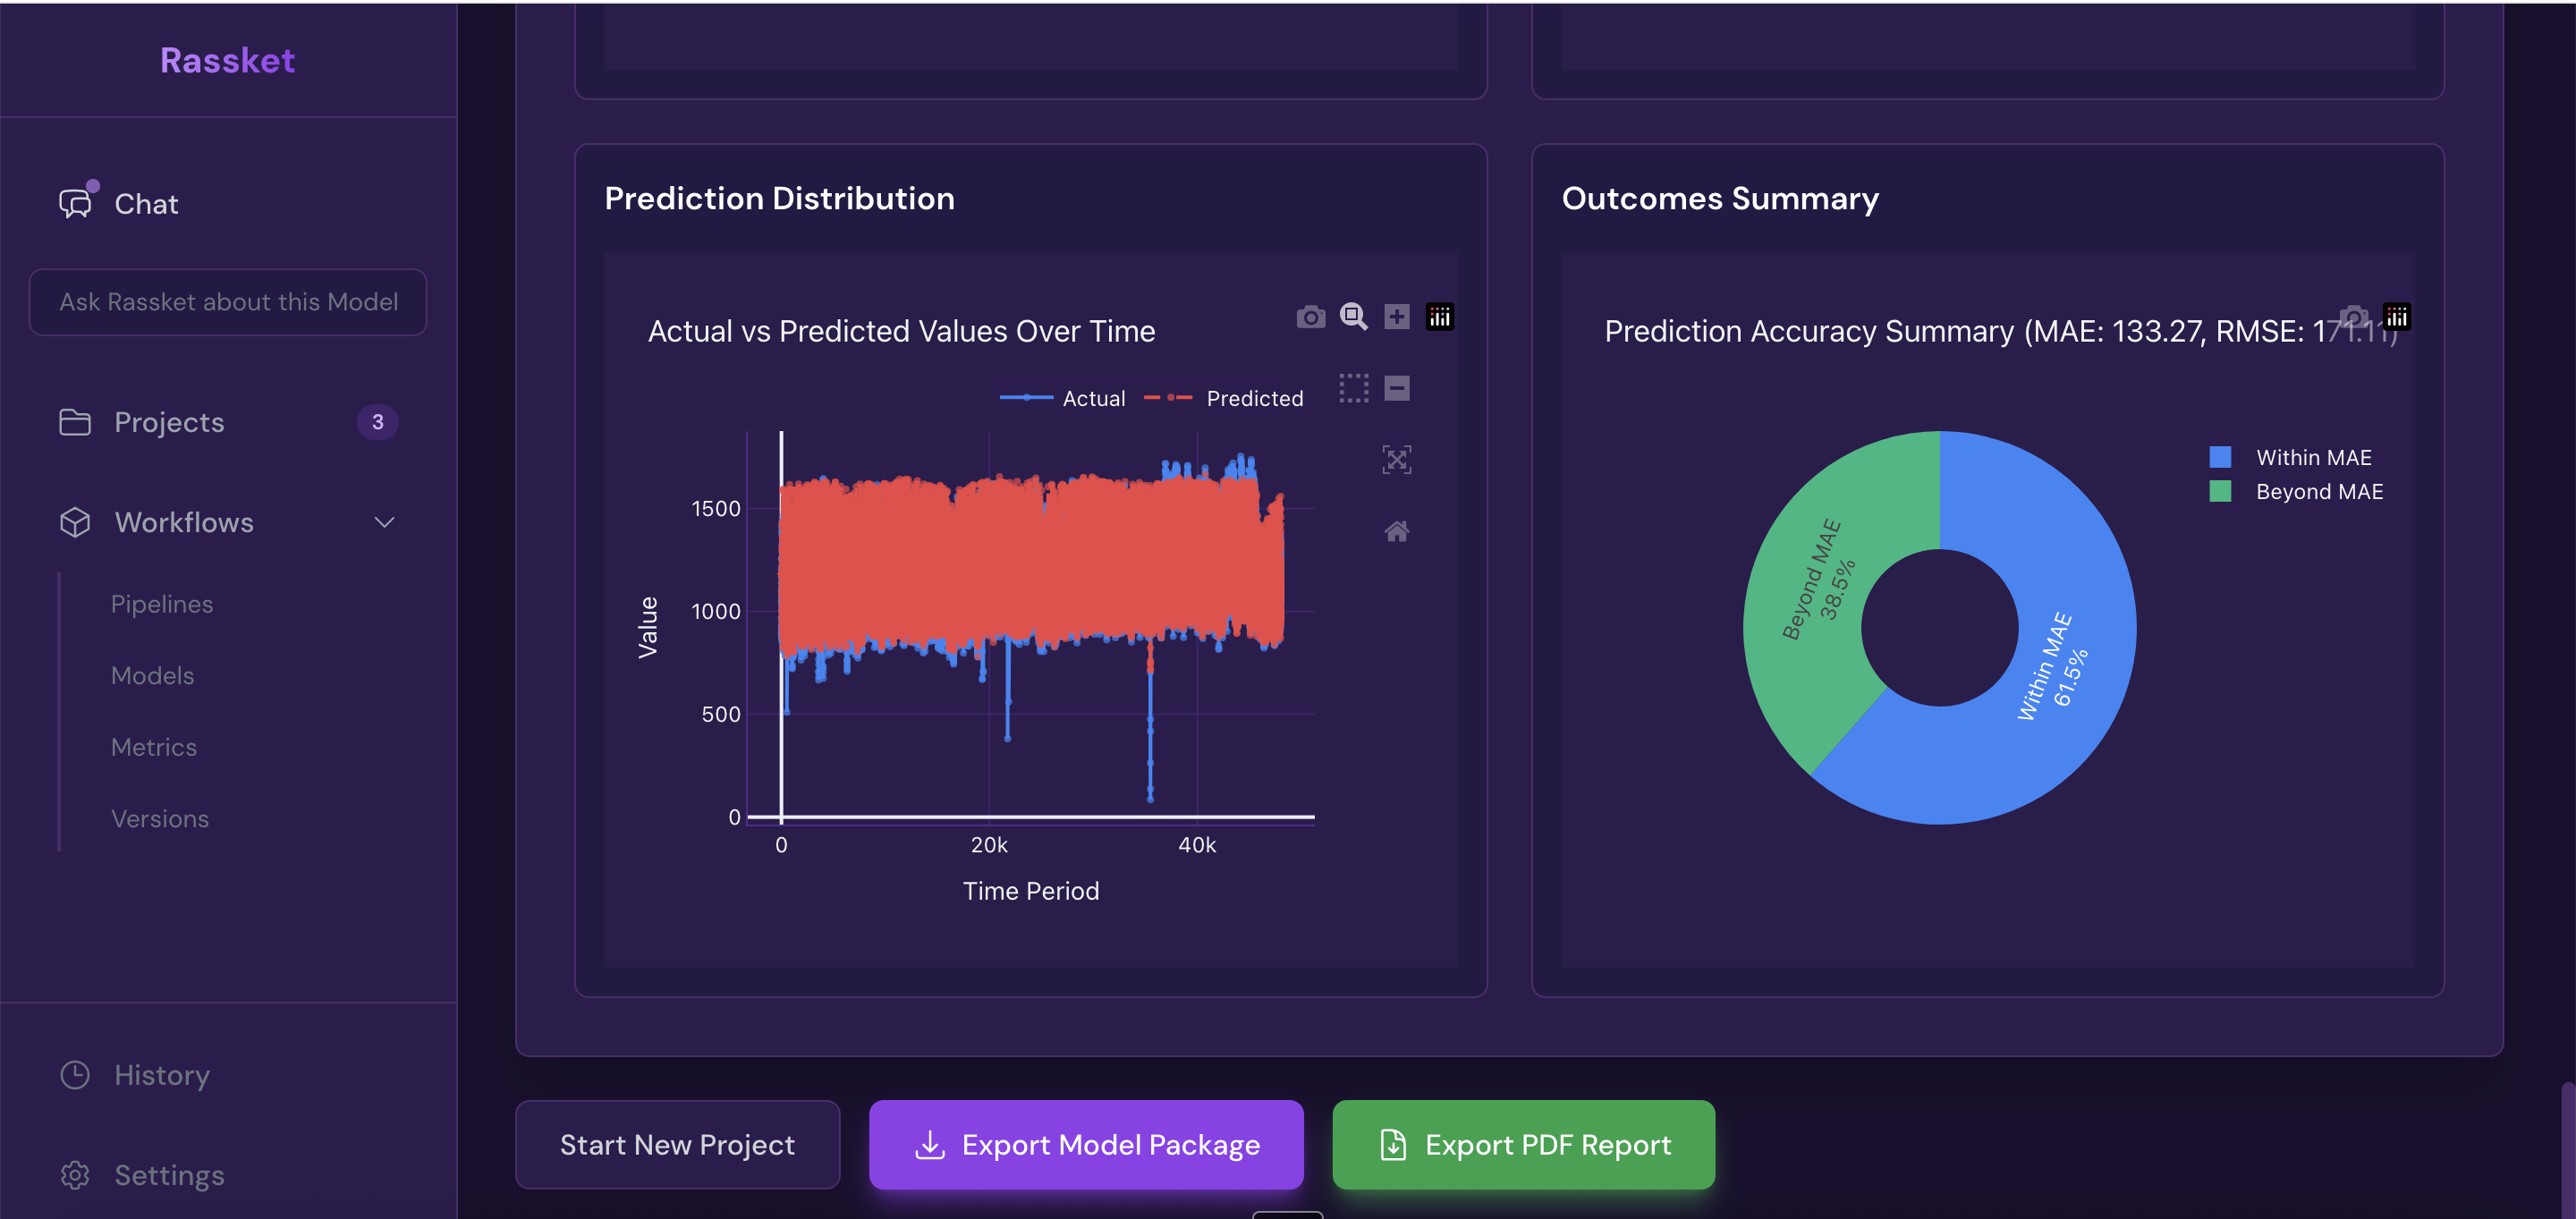
Get forecast curves, plain-English explanations, and export-ready results.
- PDF report — executive summary, forecast charts, feature importance, and metrics in one shareable document
- CSV — raw forecast data with confidence intervals for use in your own tools
- API — integrate Rassket forecasts directly into your operational systems
Step 6 — Operations
What does this do?
Operations is where control room, demand-side, and planning teams work after Results. It uses the same trained model to show predicted peak MW, when the peak is likely, risk and confidence bands, estimated cost impact under your tariff context, a recommended action window (when to pre-cool, run demand response, or notify large customers), peak drivers that explain what is moving the forecast, a seven-day outlook by day, and an alerts feed for threshold crossings and forecast revisions.
Why does it matter?
Analysts need training metrics and exports. Operators need one place to answer how high, how soon, how sure, and what to do before then. Operations keeps everyone on the same forecast without rebuilding spreadsheets each shift.
What you see
- Command center — headline peak, peak time band, risk level, central vs upper-scenario MW
- Cost impact — scenarios if peak is higher or lower than expected
- Action window — when to act and suggested moves in plain English
- Load forecast chart — 24 / 48 / 72 hour views, confidence band, markers for now and peak
- Peak drivers and outlook — what shapes today's peak and a simple seven-day MW picture
- Alerts — critical, warning, and resolved items with timestamps
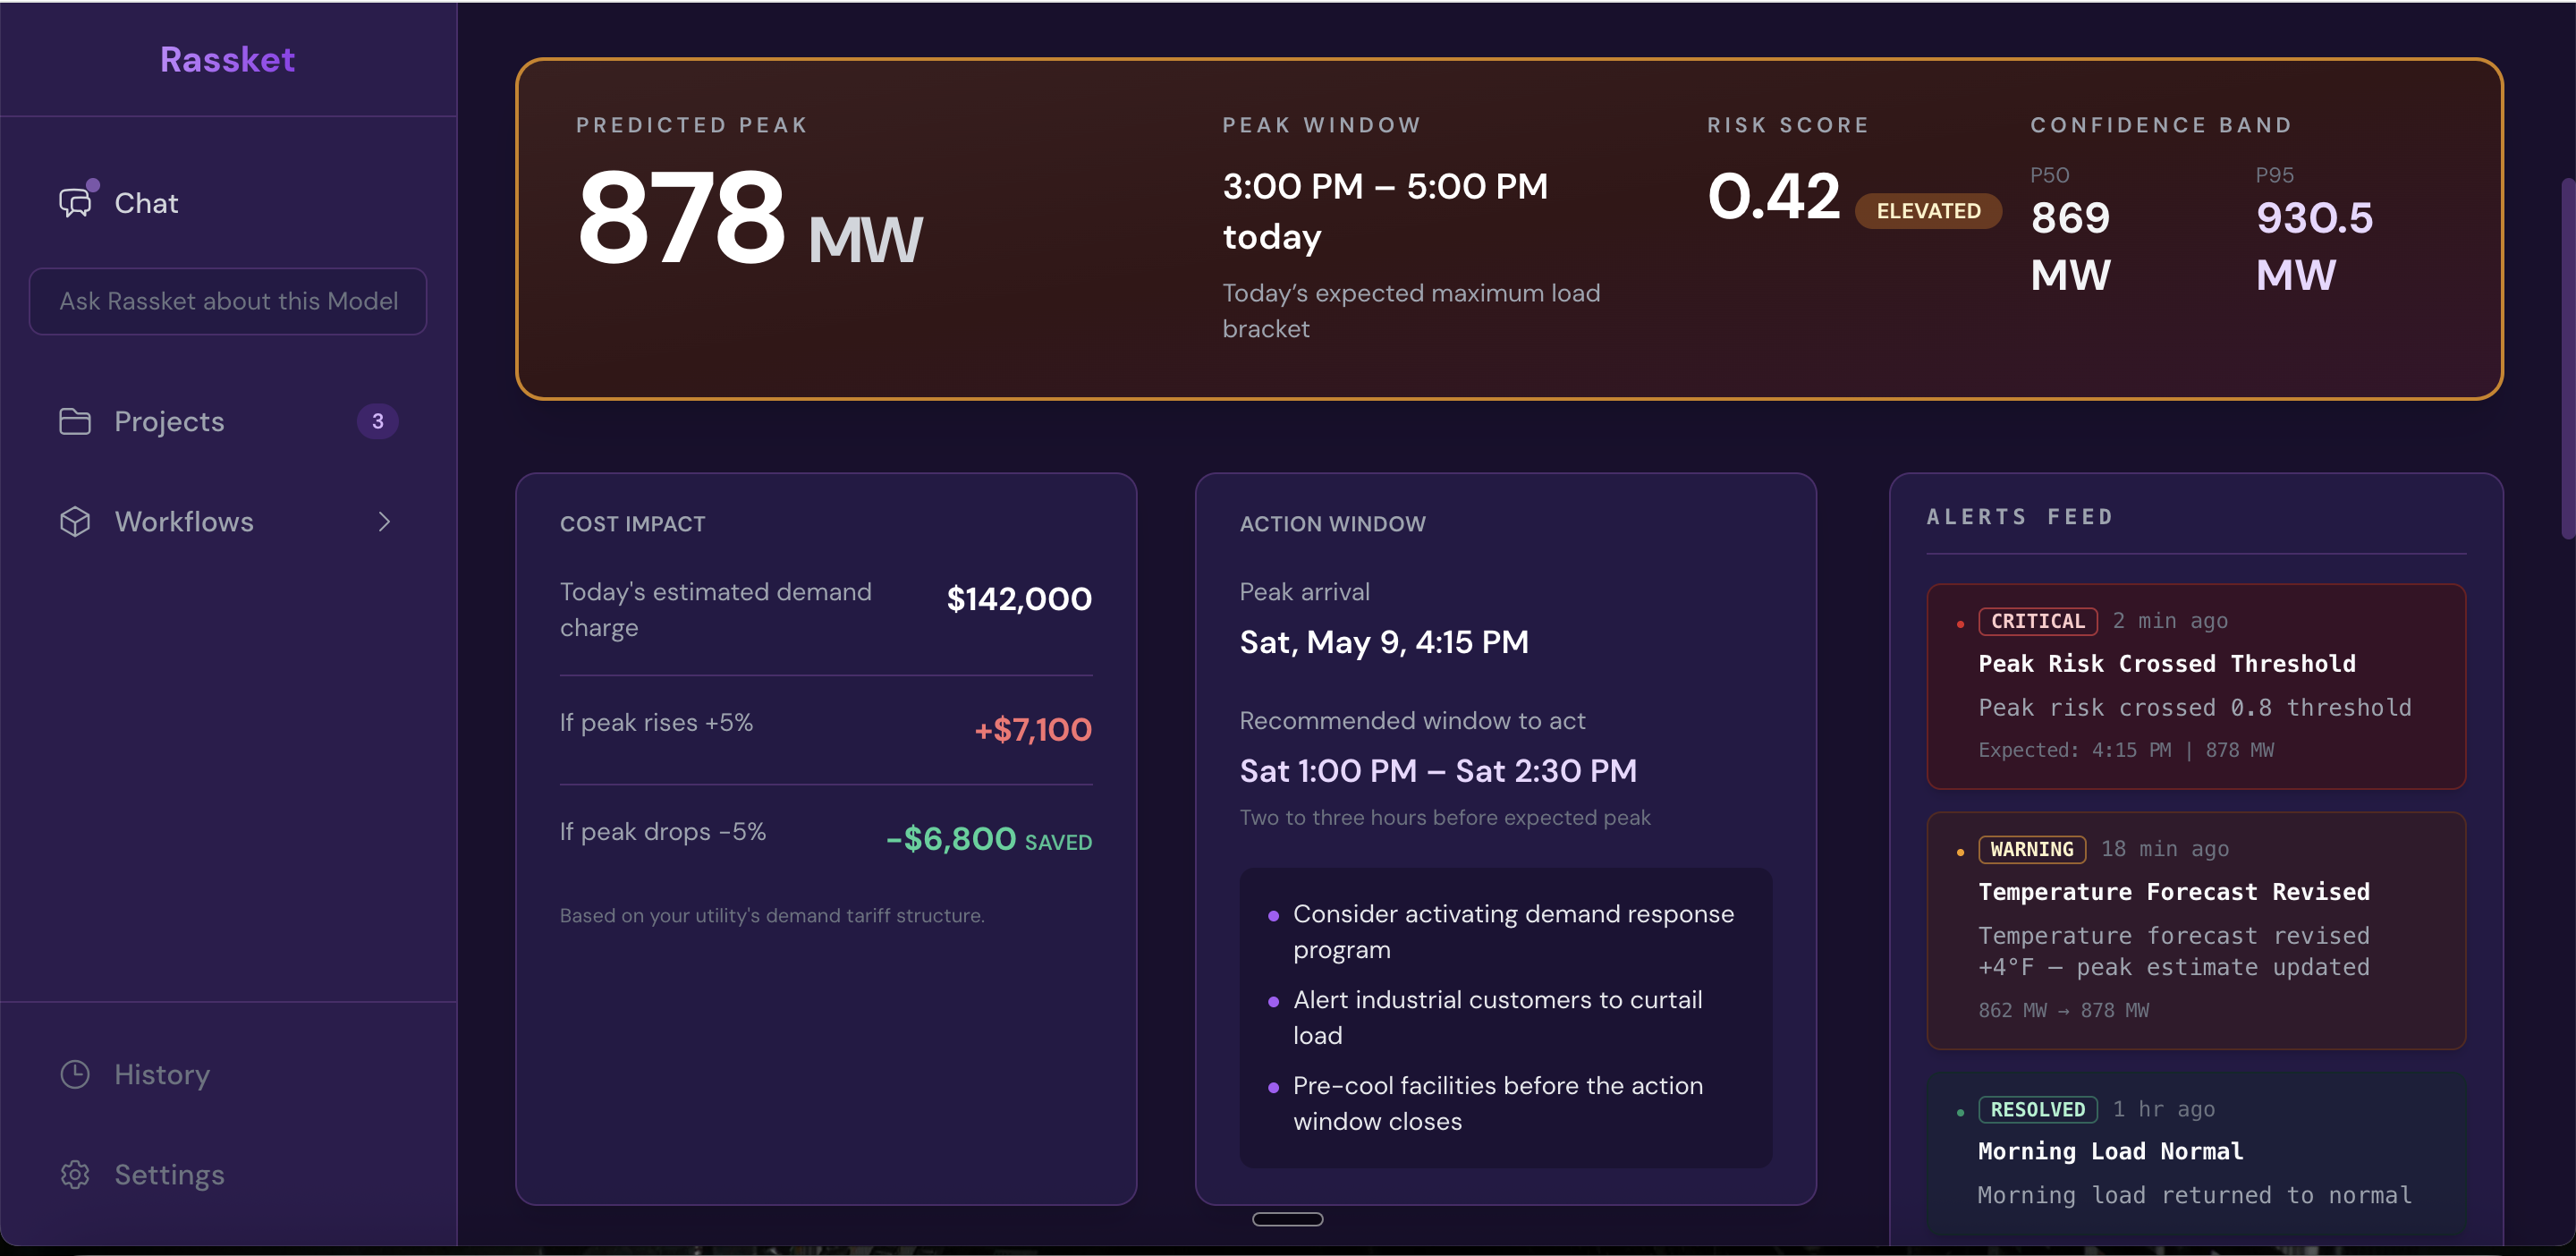
Operations command center — peak, risk, confidence, cost scenarios, when to act, and alerts so teams can respond in time.
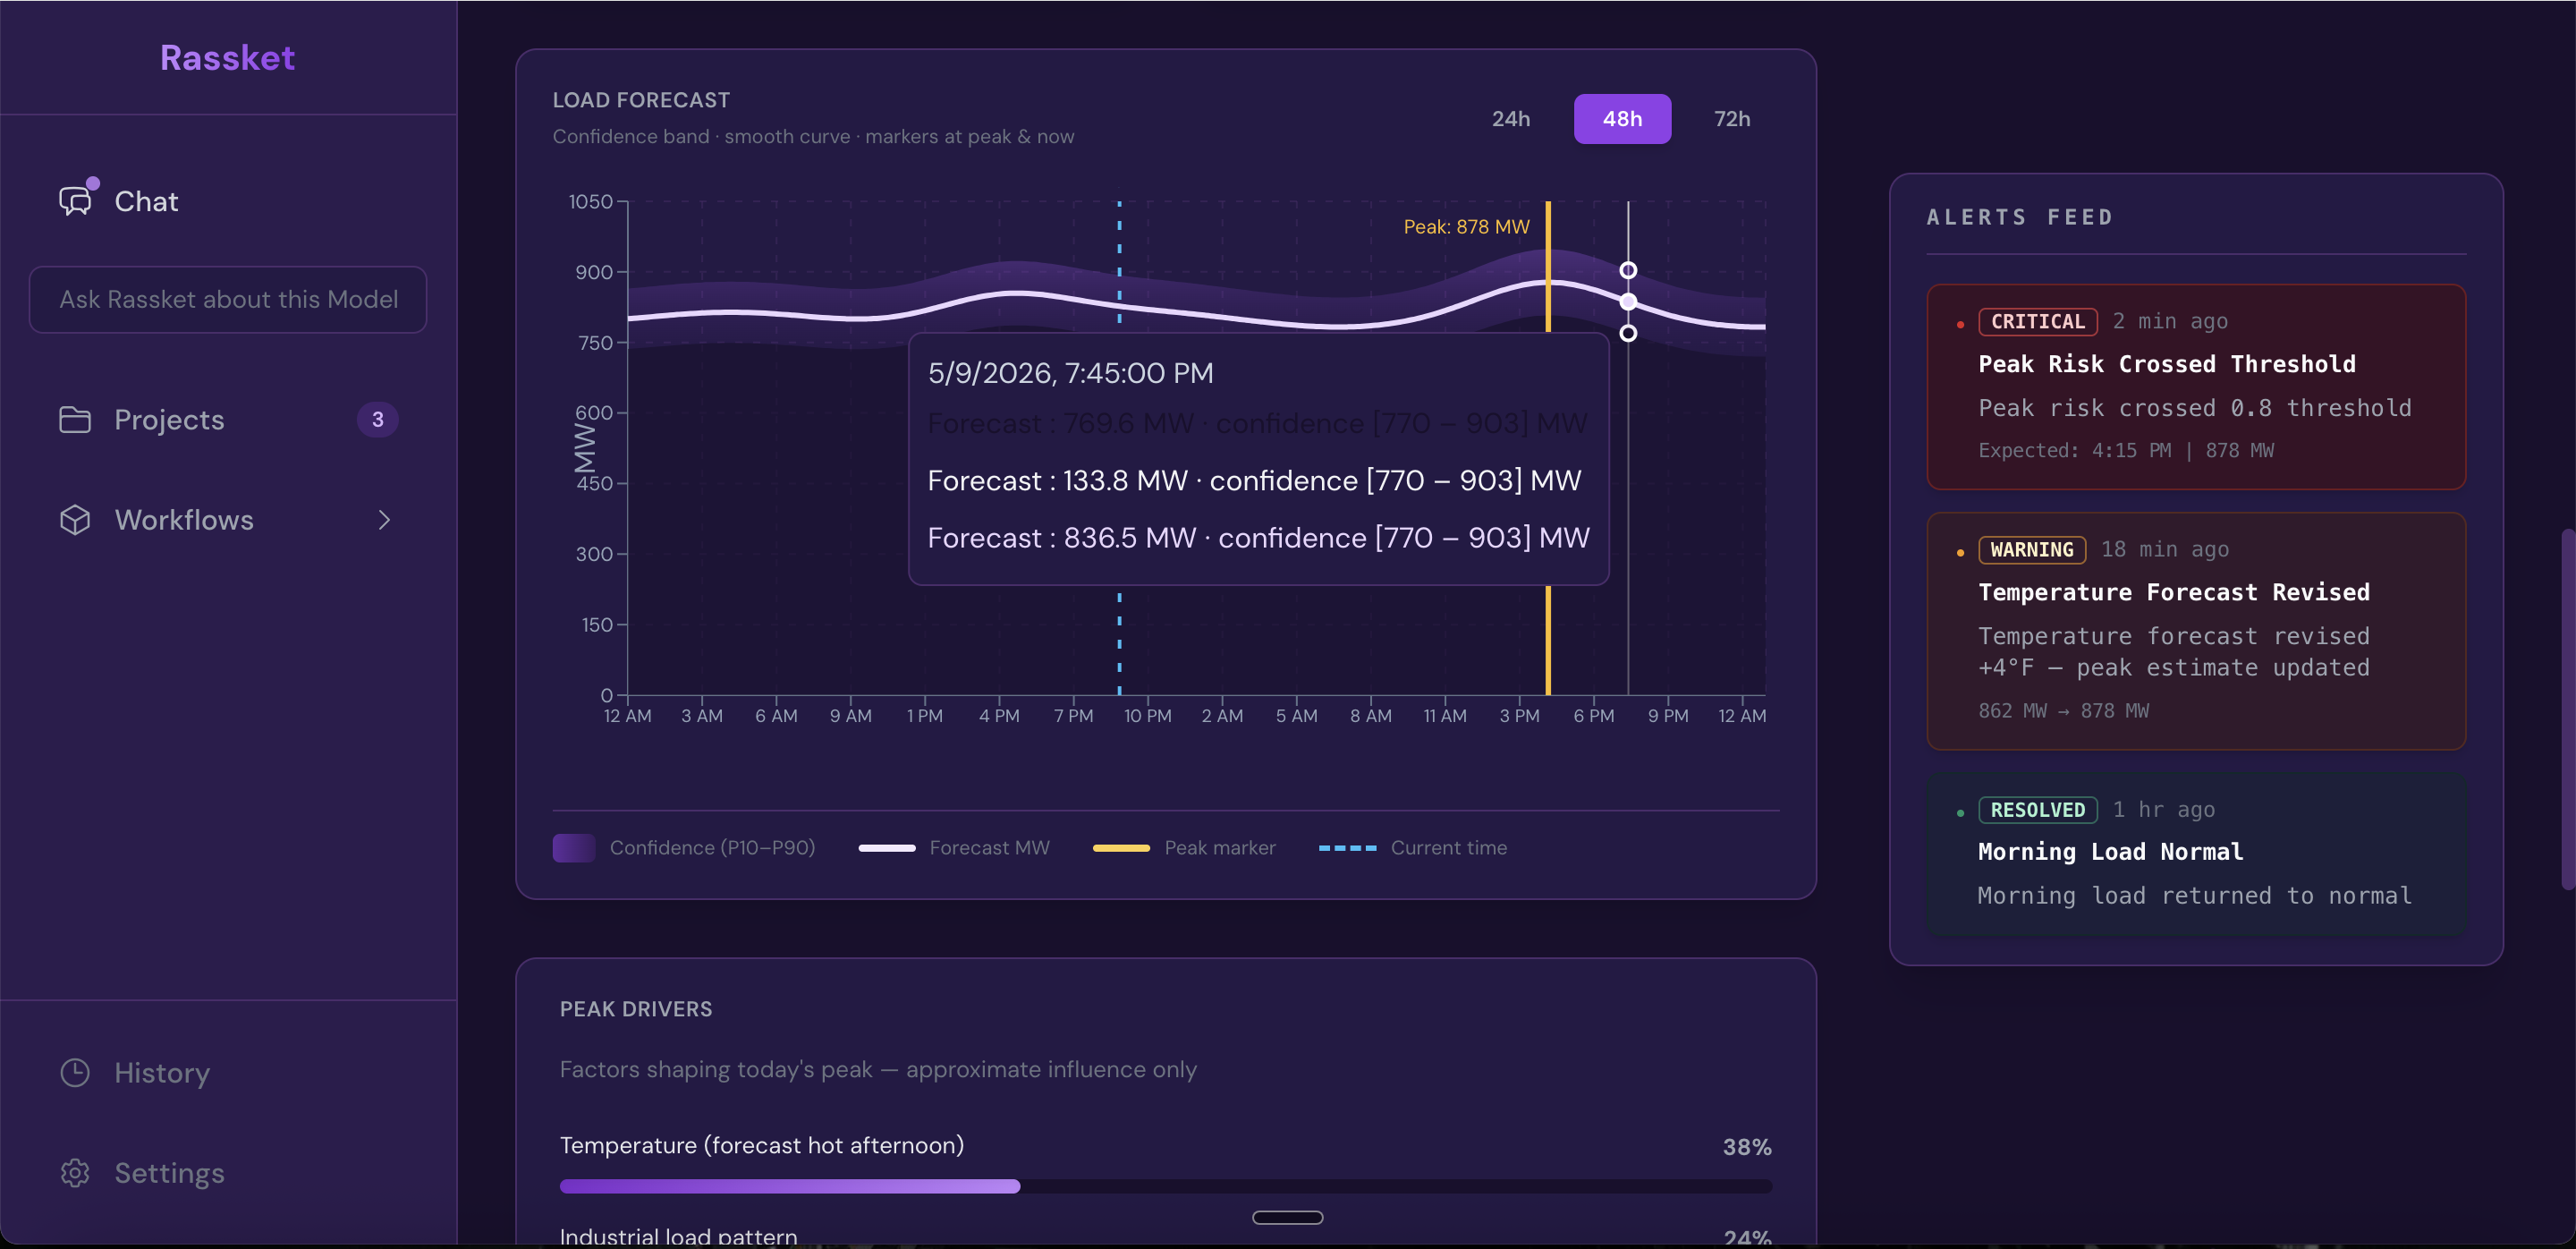
Load forecast for operators — switch horizon, read the band, align crews and DR with the same curve.
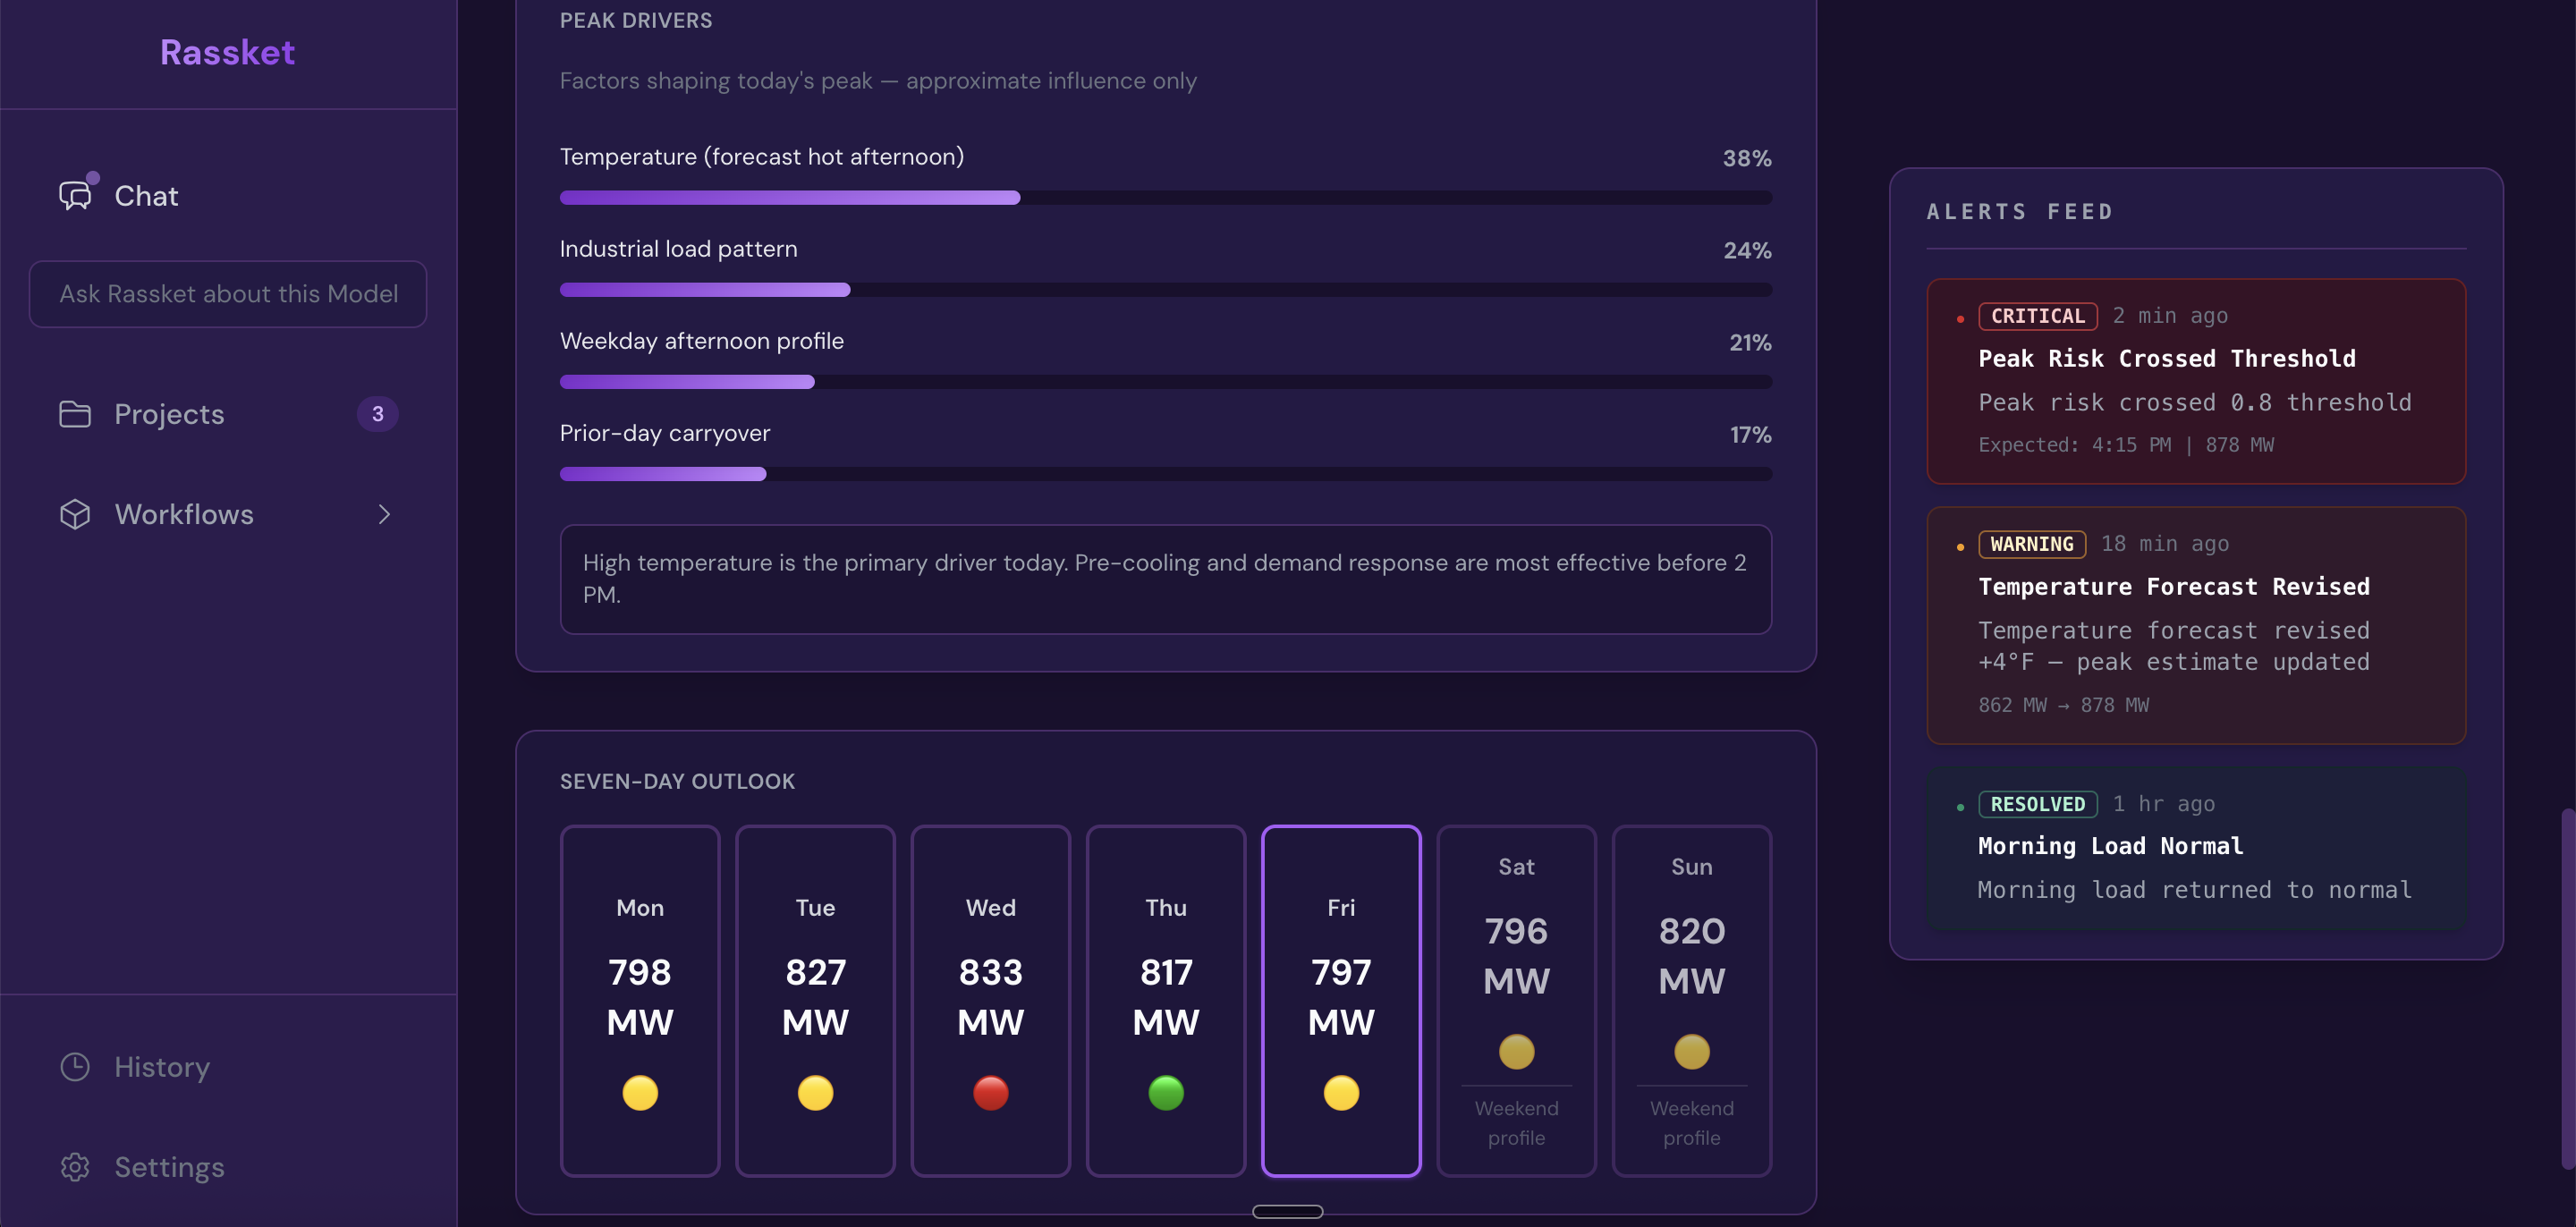
Peak drivers, plain-English guidance, weekly outlook, and alerts — built for operations teams who need to act.
Workflow Summary
- Upload — file upload or live database connector (Getting Started)
- Preprocessing — automatic validation, imputation, and feature preparation
- Analysis — targets, problem type, and readiness checks before training
- Training — automated prediction model build with time-aware cross-validation
- Results — forecast curves, explanations, NL queries, decision simulations, and exports
- Operations — peaks, drivers, outlook, action windows, and alerts for running the grid
Domain selection and utility context are chosen early, before preprocessing.
Next Steps
- Read the full Operations guide for grid and control room teams
- Learn how the Prediction Engine works under the hood
- See all Insights & Exports in detail
- Read the FAQ for common questions