Insights & Exports
After training completes, Rassket gives you a full set of results — forecast curves, plain-English explanations, and exports ready for your team, your stakeholders, and your operational systems. This page covers everything you receive and how to use it.
What does this do?
Rassket translates a trained prediction model into outputs you can read, share, and act on. You do not need to interpret raw model metrics or write code to extract results. Everything is formatted and explained automatically.
Why does it matter?
A forecast model is only useful if you can trust it, explain it, and use it in your workflow. Rassket provides the confidence intervals, feature explanations, and export options that make your forecasts decision-ready.
Forecast Results
Forecast Curves
- Point forecast — the predicted value at each time step
- Upper confidence interval — the upper bound of the forecast range
- Lower confidence interval — the lower bound of the forecast range
- Actual vs forecast plot — side-by-side comparison of predictions against real values where available
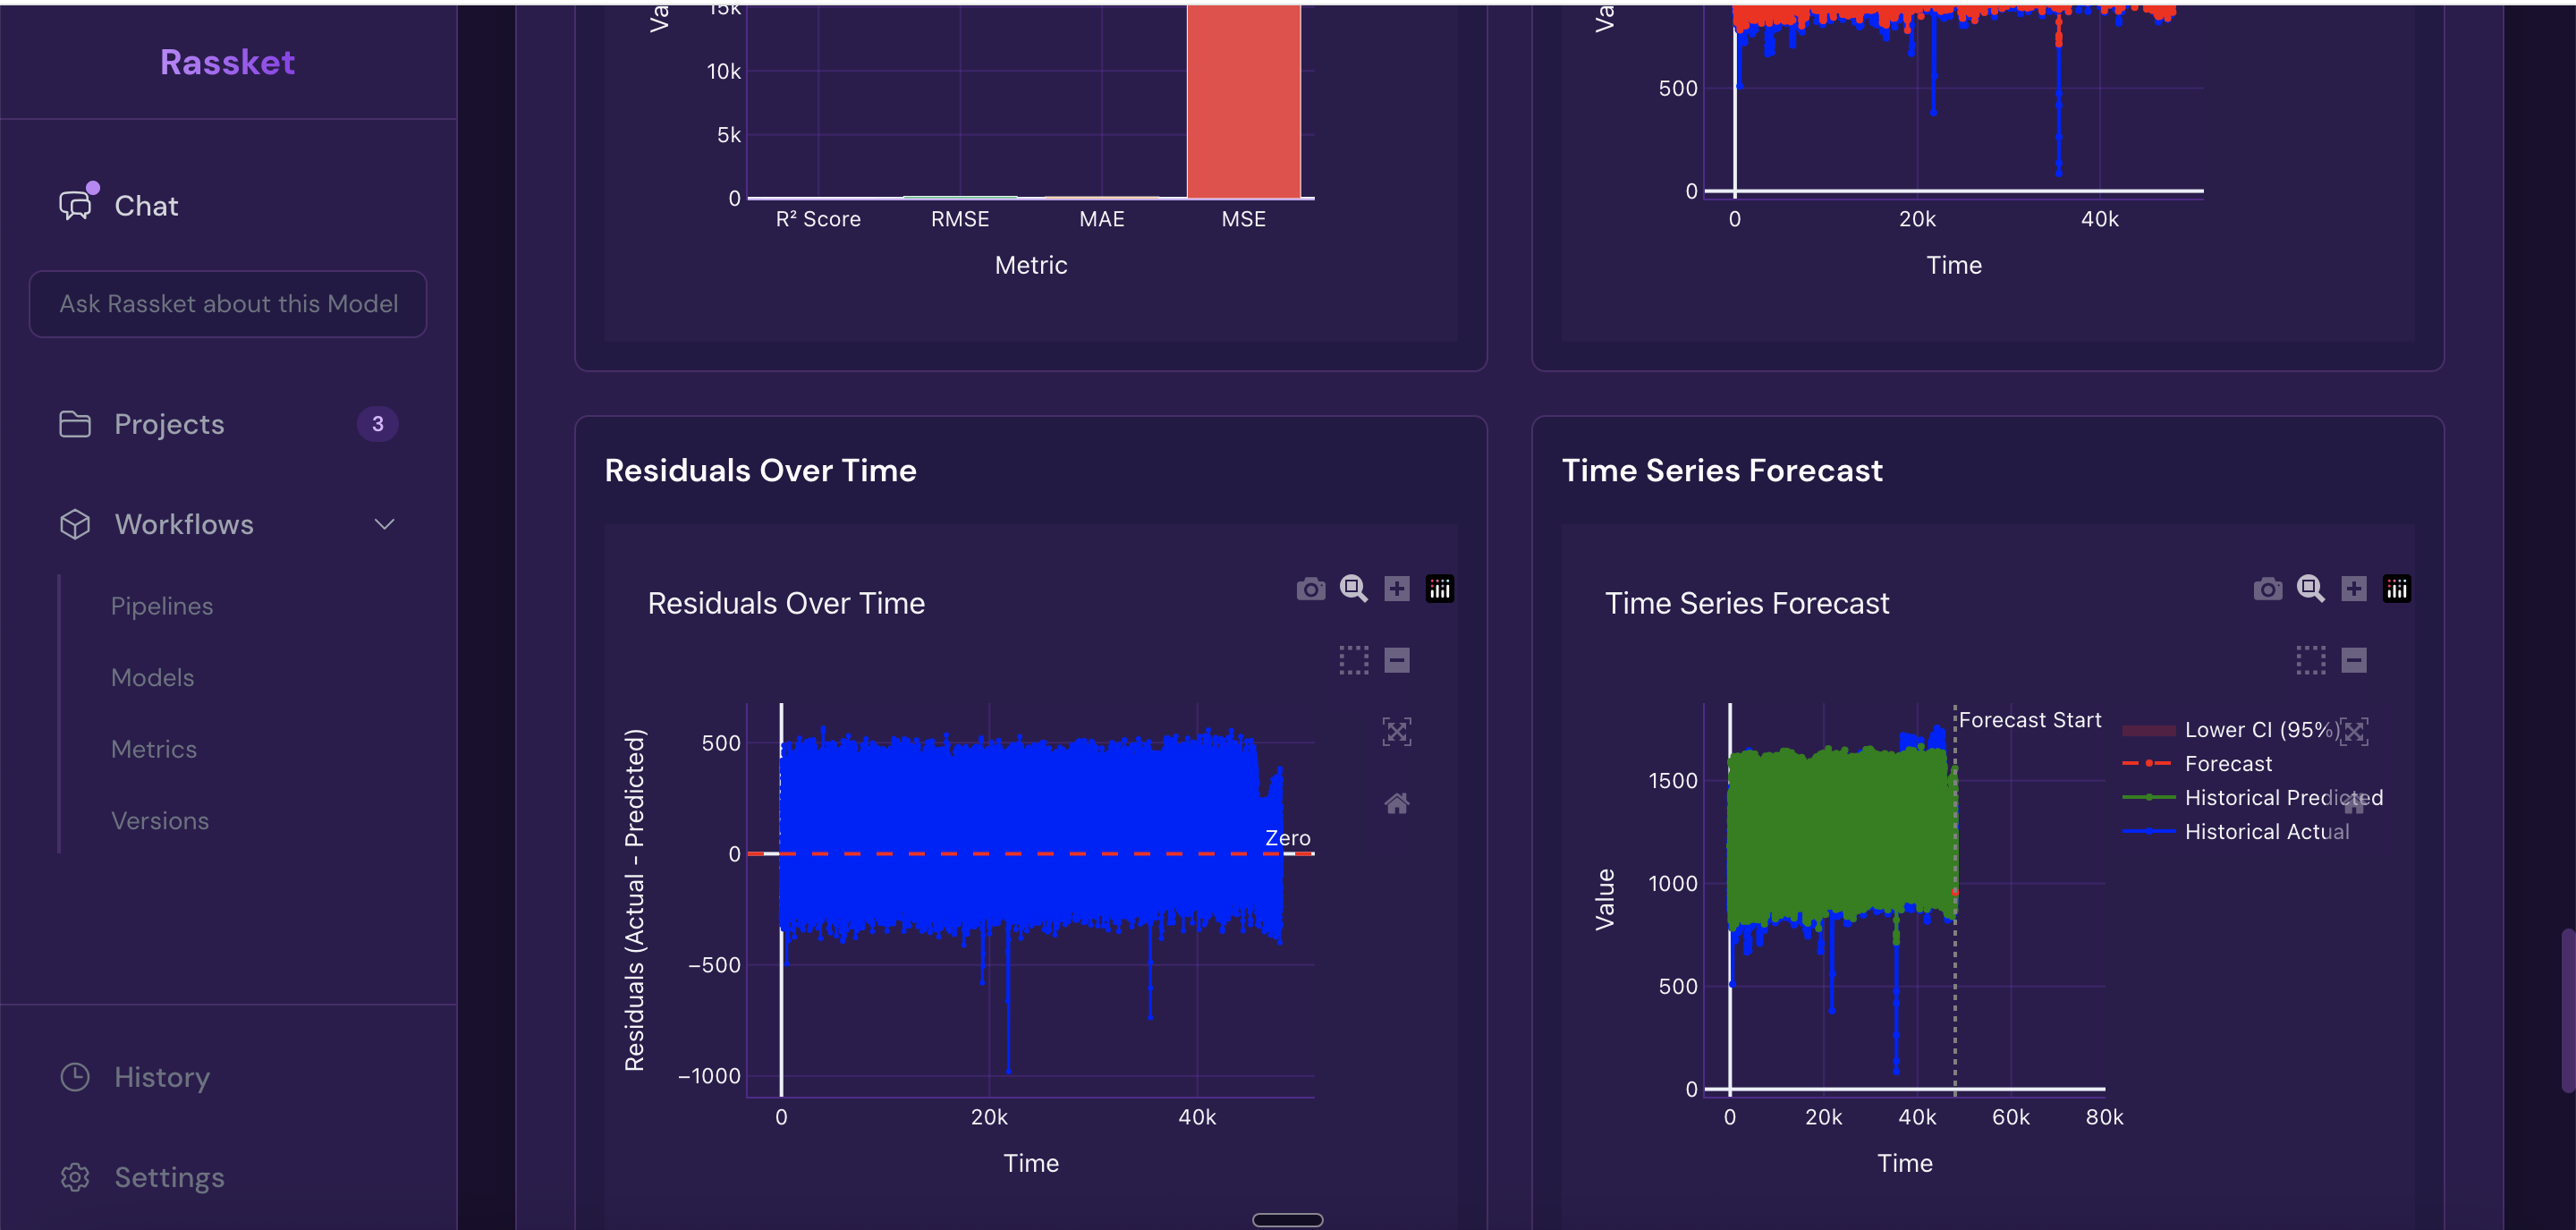
Forecast curves with upper and lower confidence intervals — actual vs predicted plotted over time.
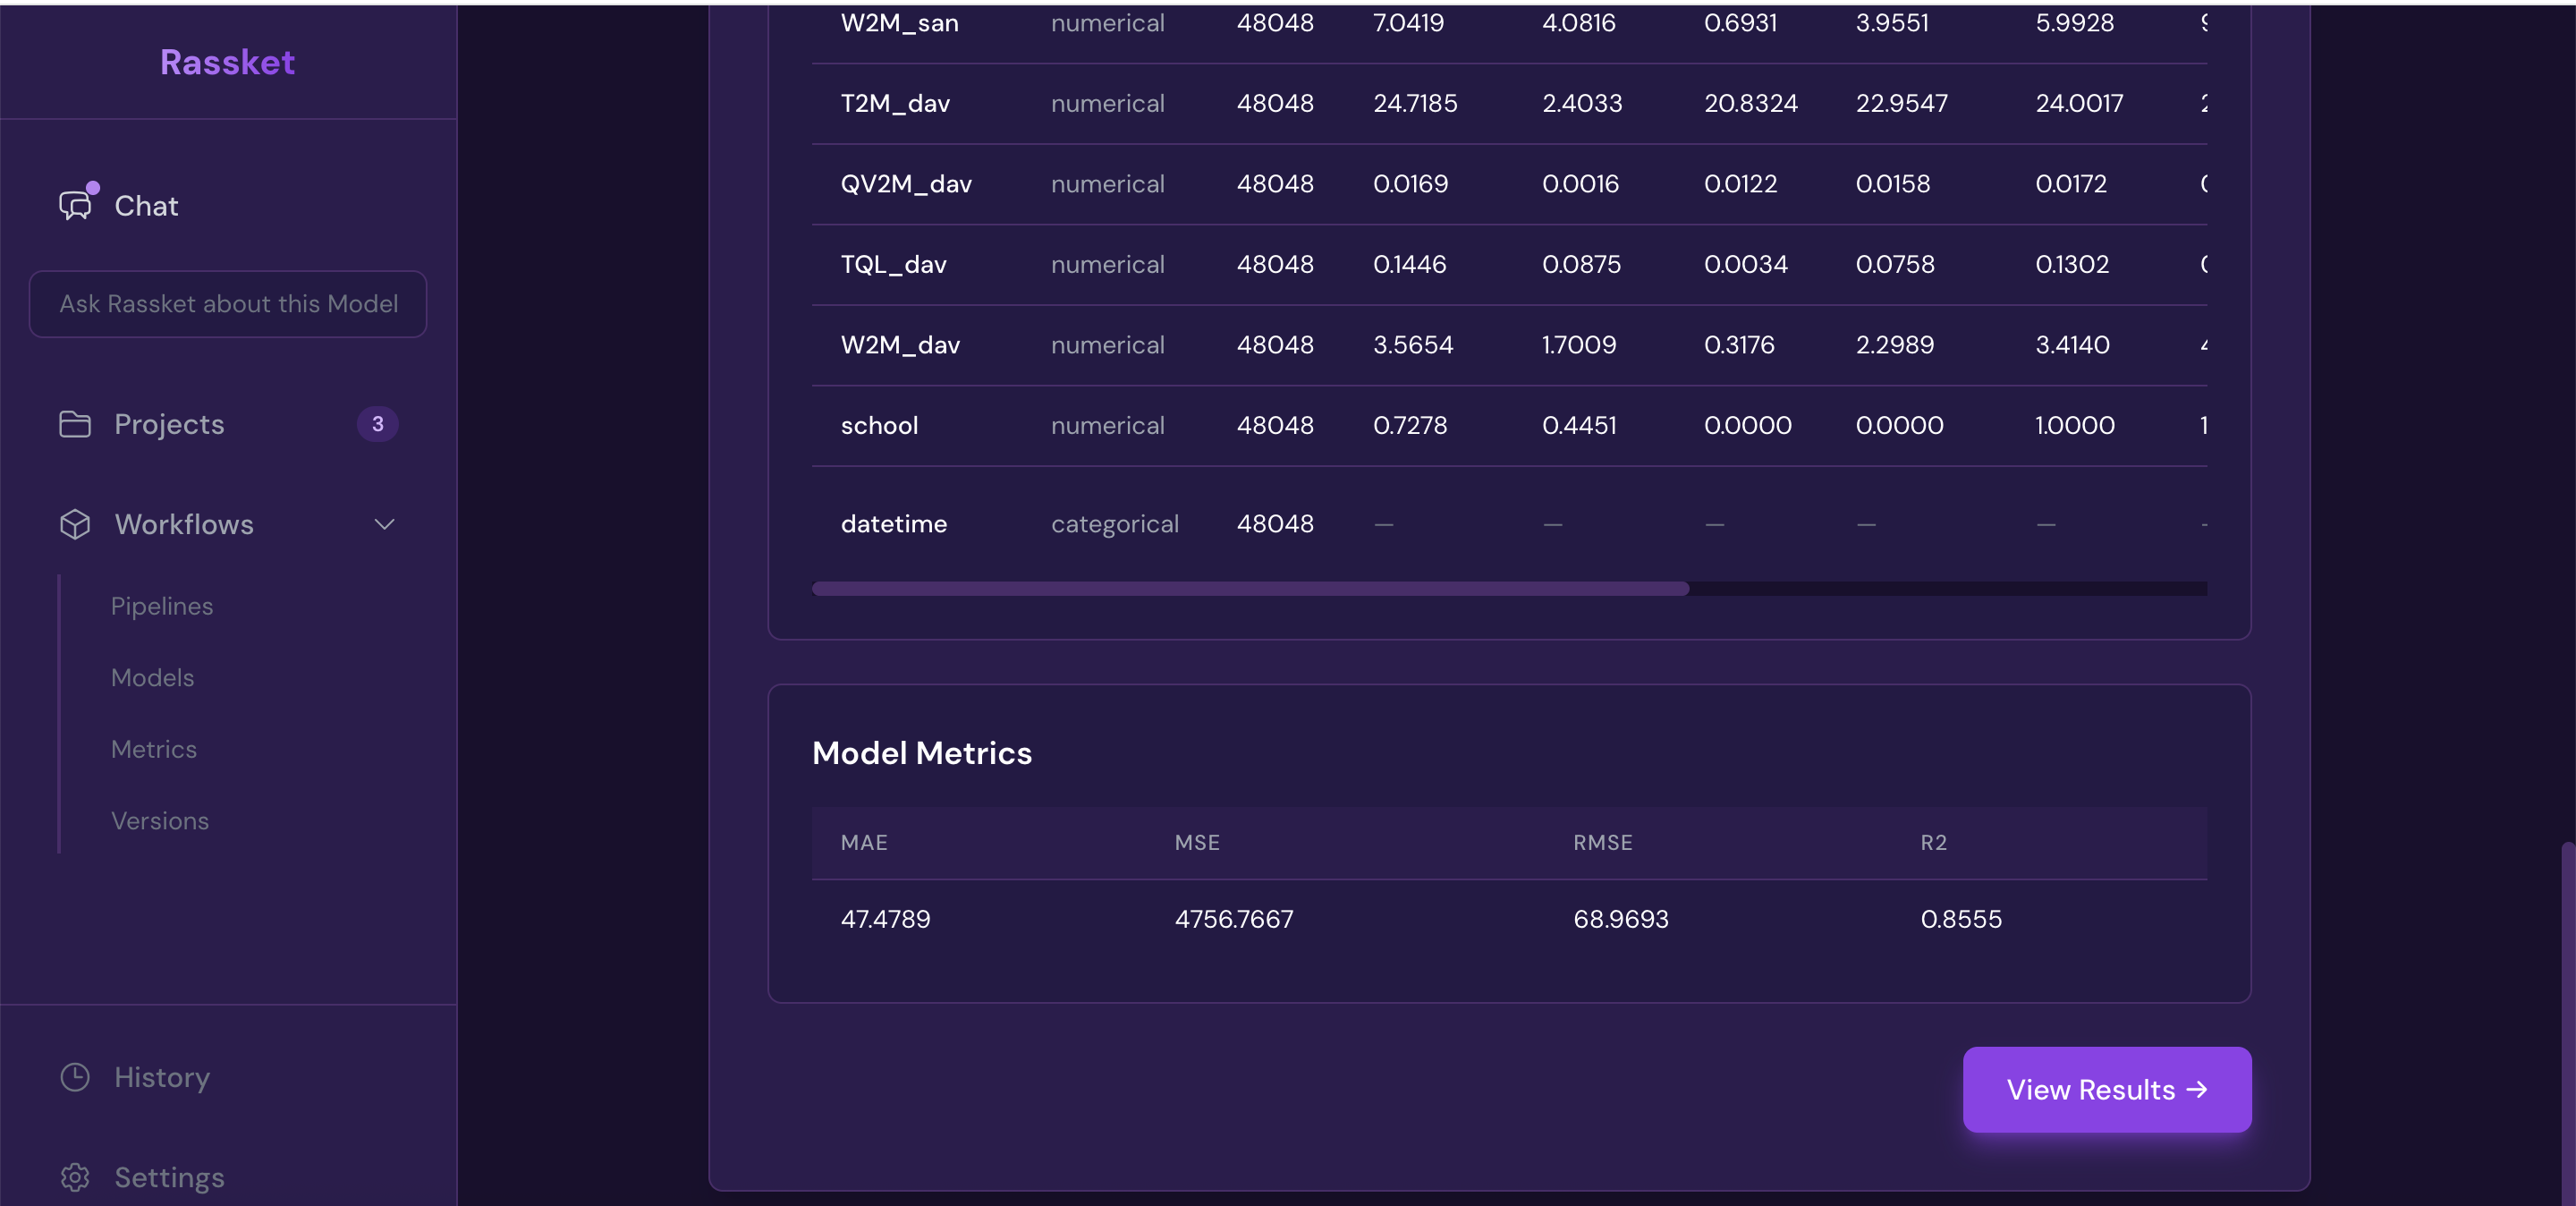
Accuracy Metrics
- RMSE — Root Mean Squared Error, how far off predictions are on average
- MAE — Mean Absolute Error, the average absolute error across all time steps
- R² — how much of the variation in your data the prediction model explains
- Train vs validation comparison — confirms the model is not overfitting to historical data
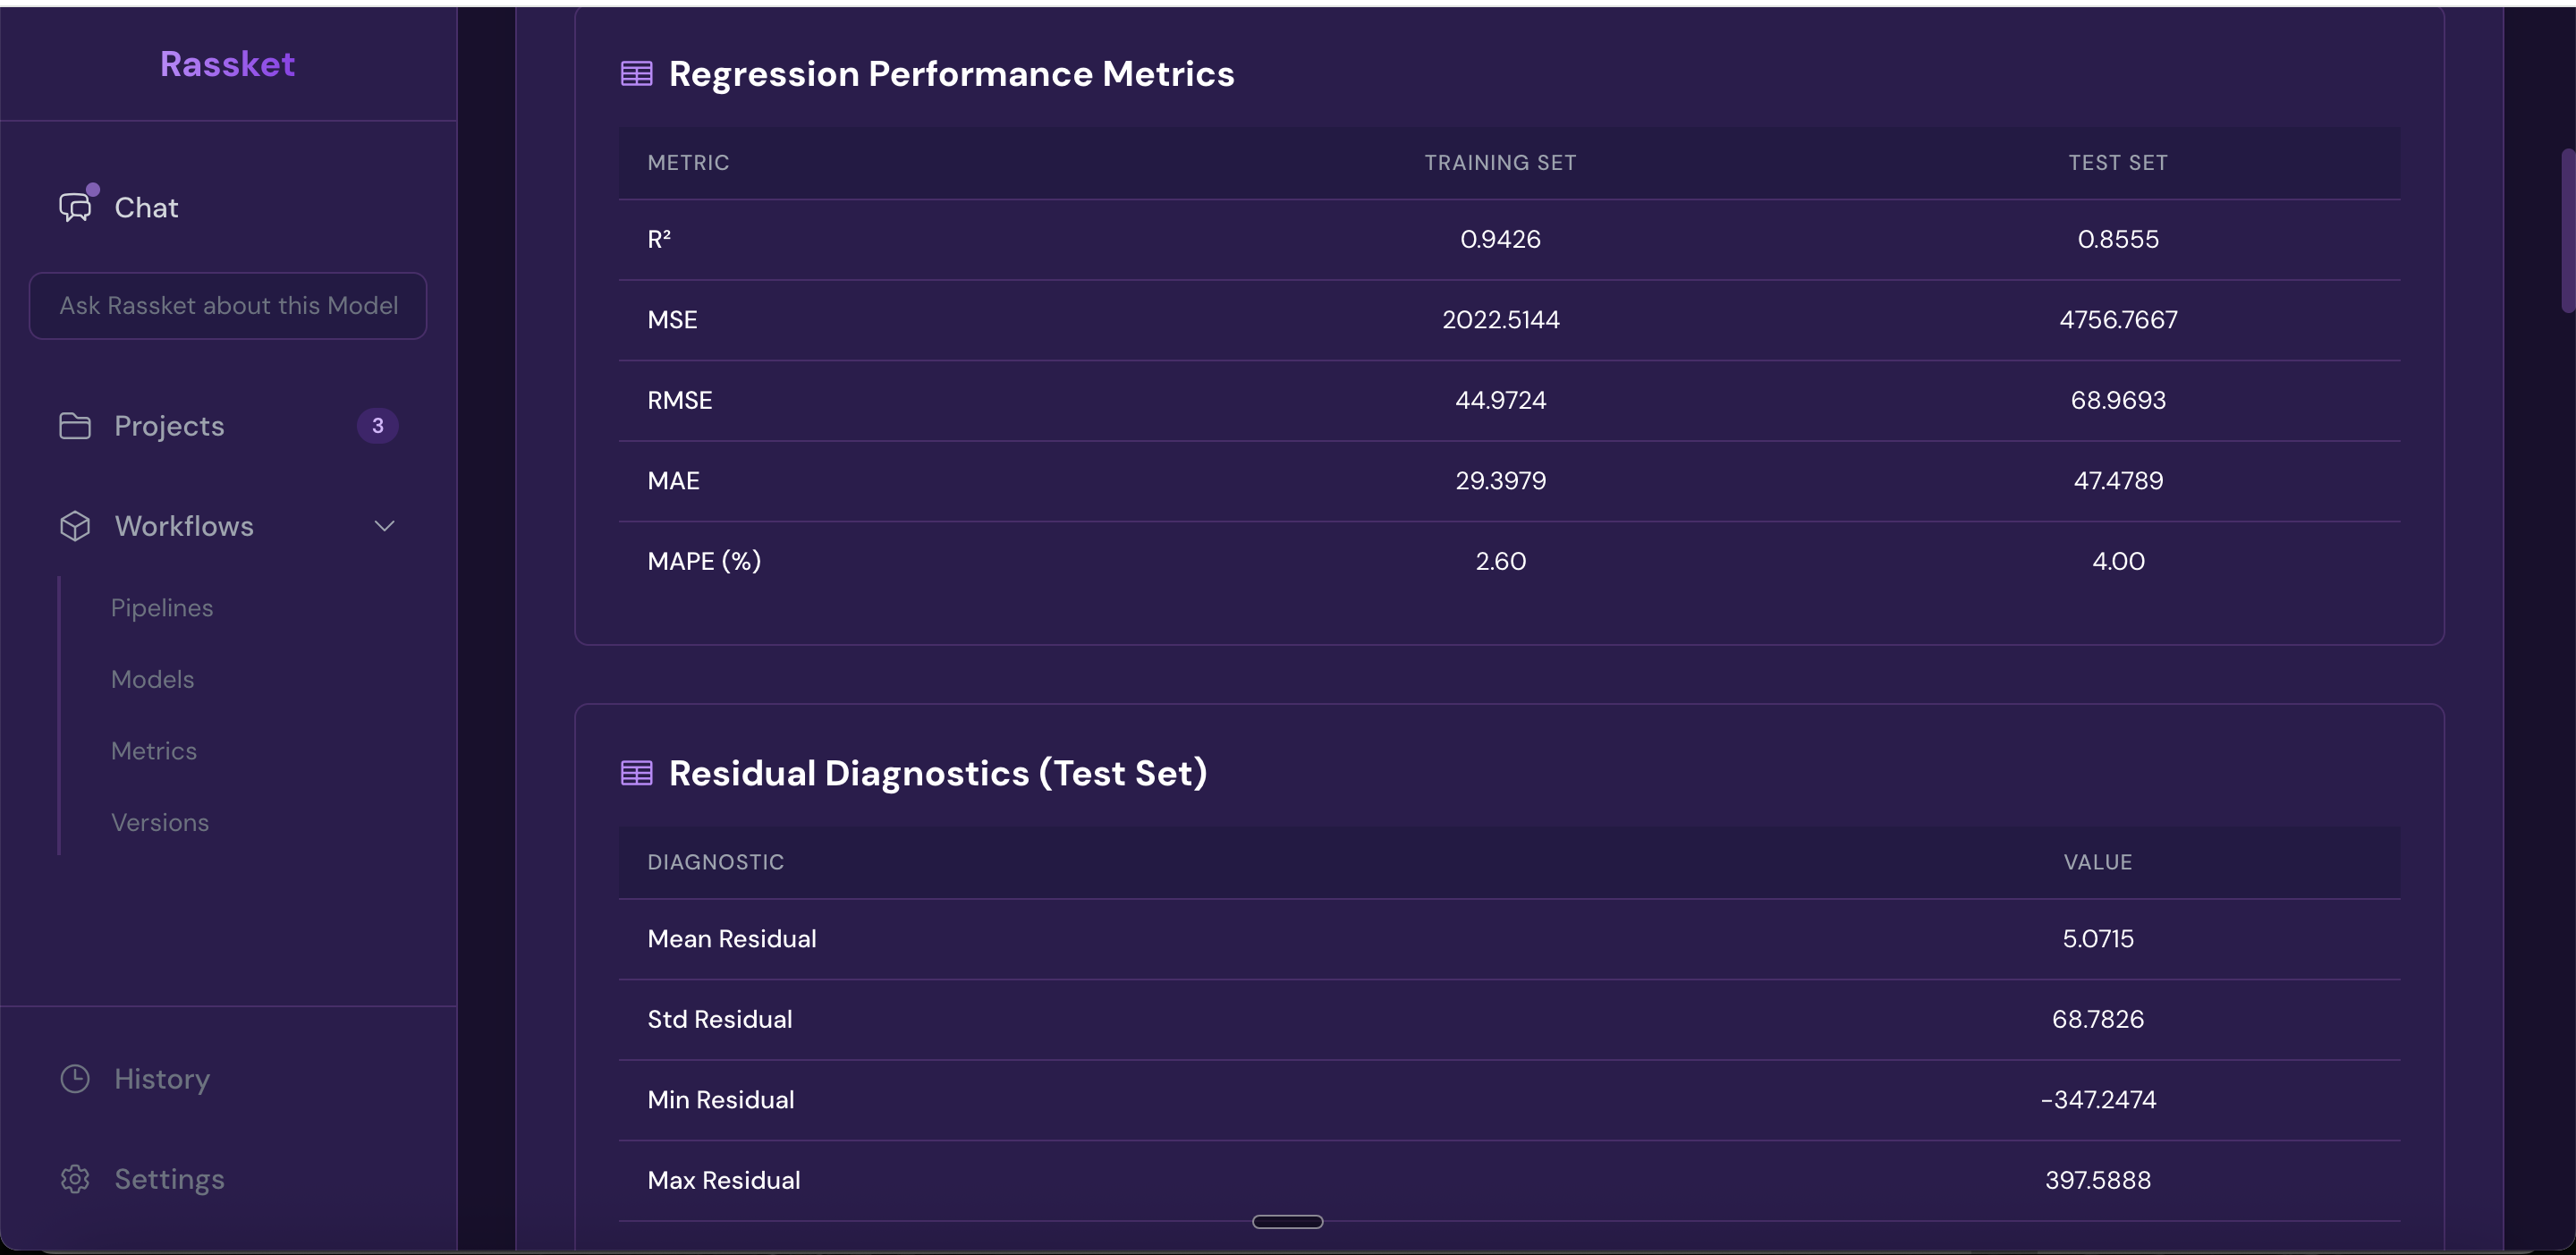
Full accuracy metrics — every relevant measure shown in one place, with plain-English context.
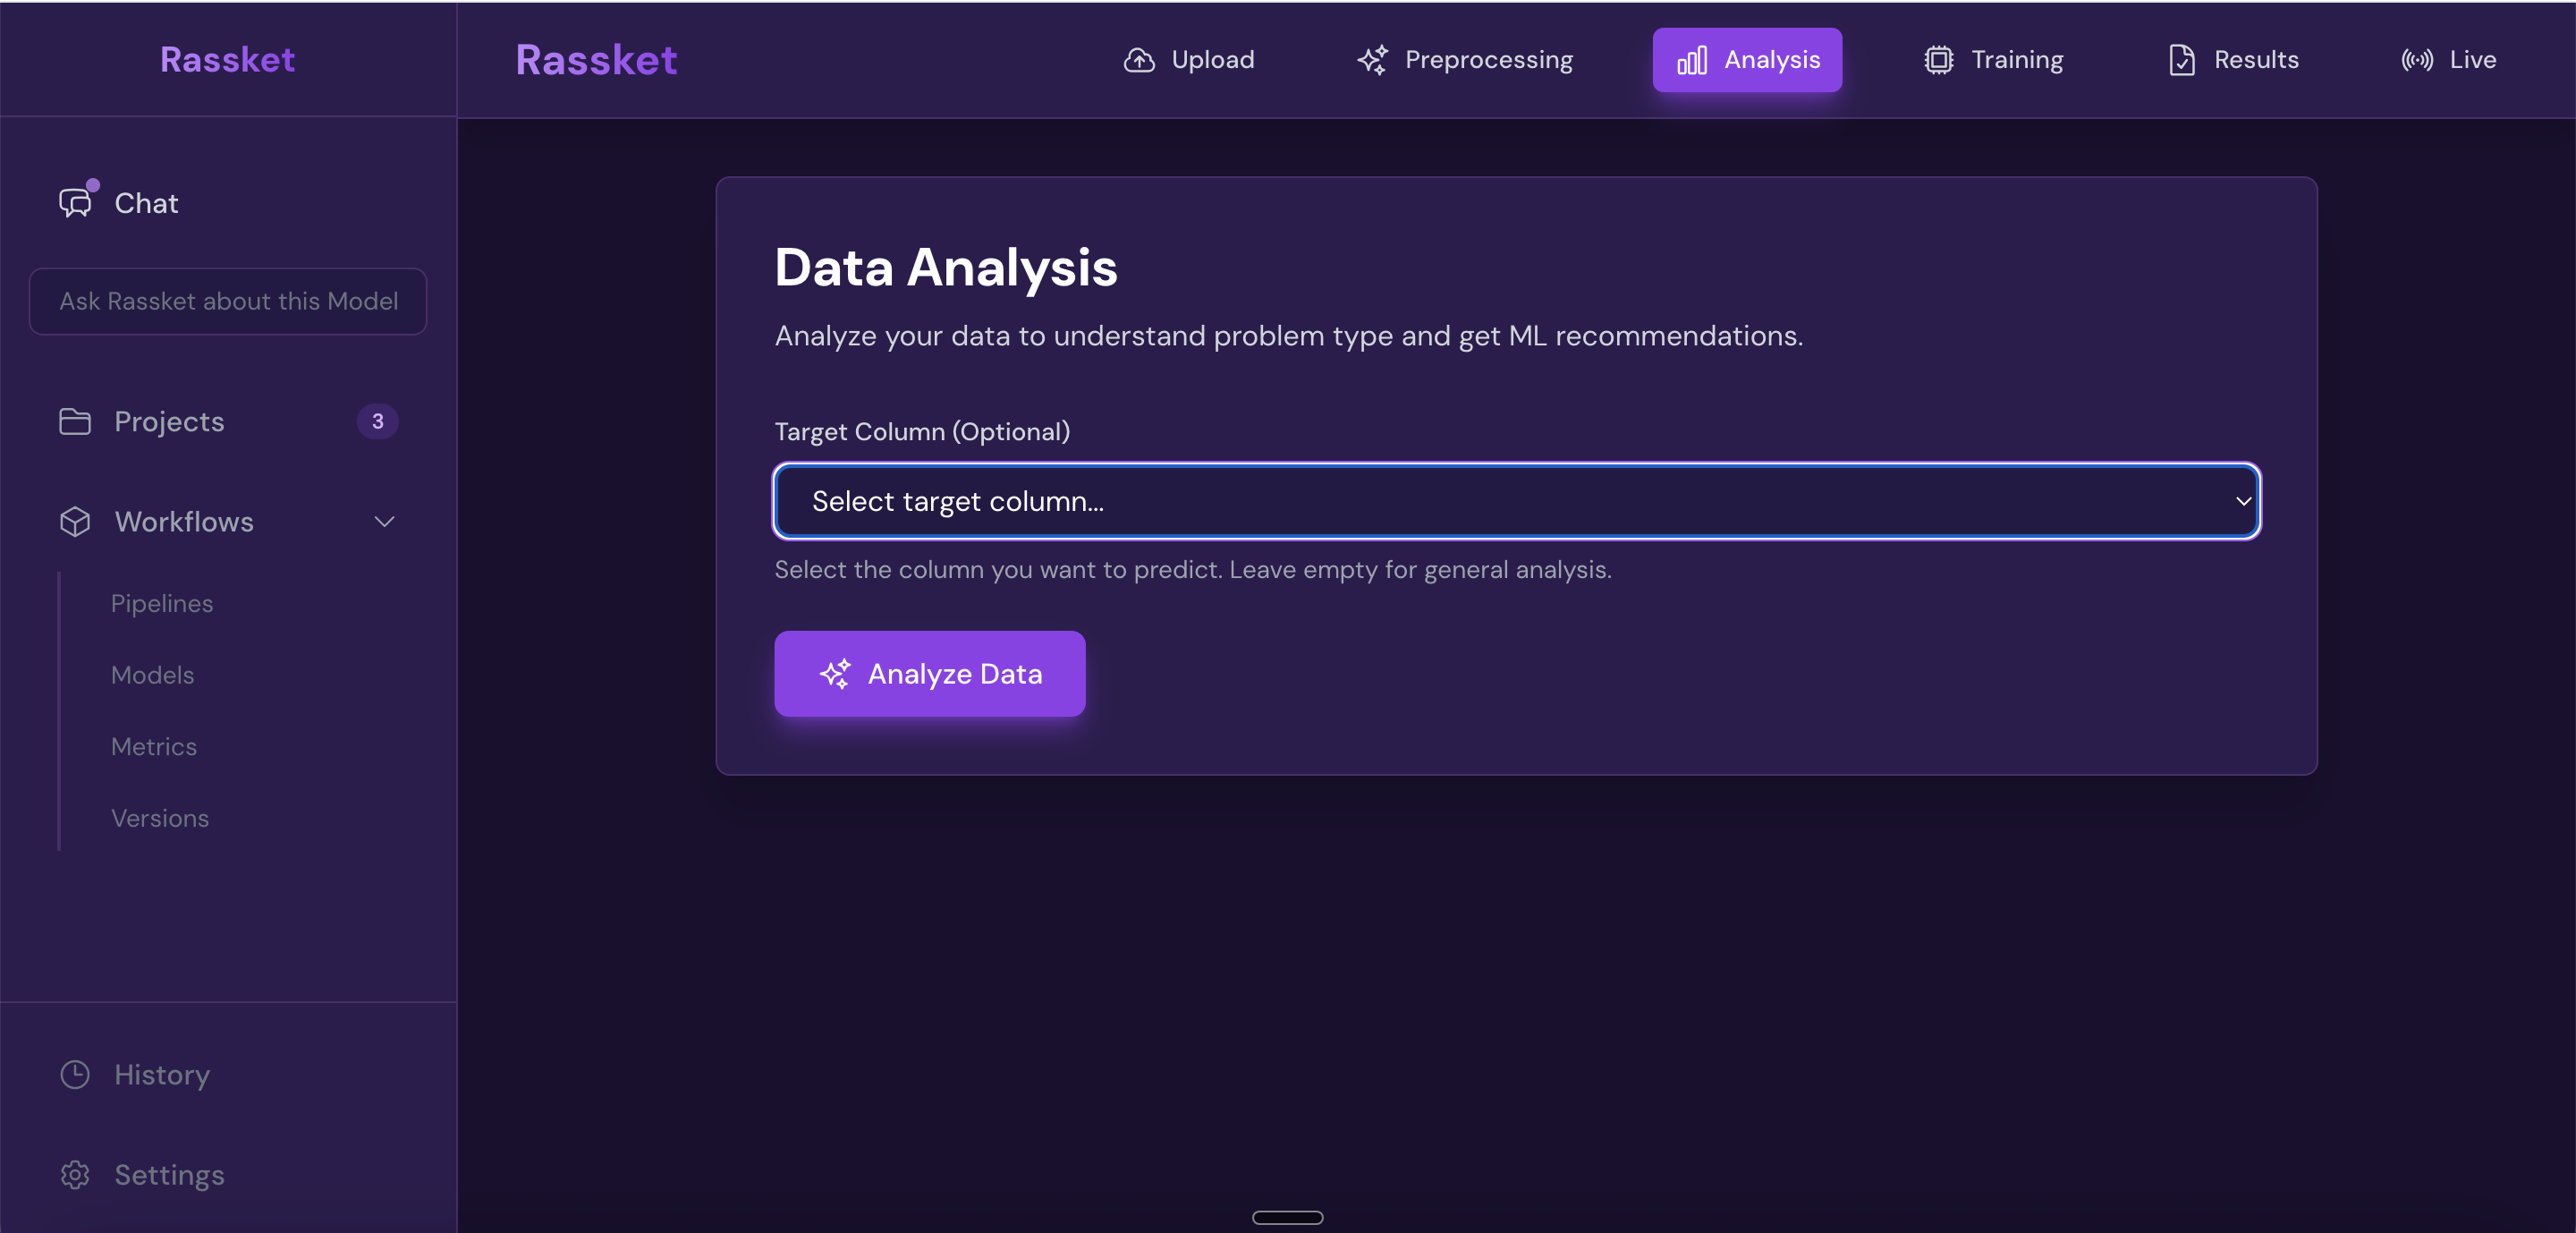
Select the forecast output you want to review — summary statistics and breakdowns for each target.
Feature Importance
After training, Rassket explains which inputs drove the forecast and by how much — in plain English. You do not need to understand SHAP values or model internals. The explanation is written in the context of your energy domain and utility.
Feature importance explained in plain English — see exactly what drives your forecast and why.
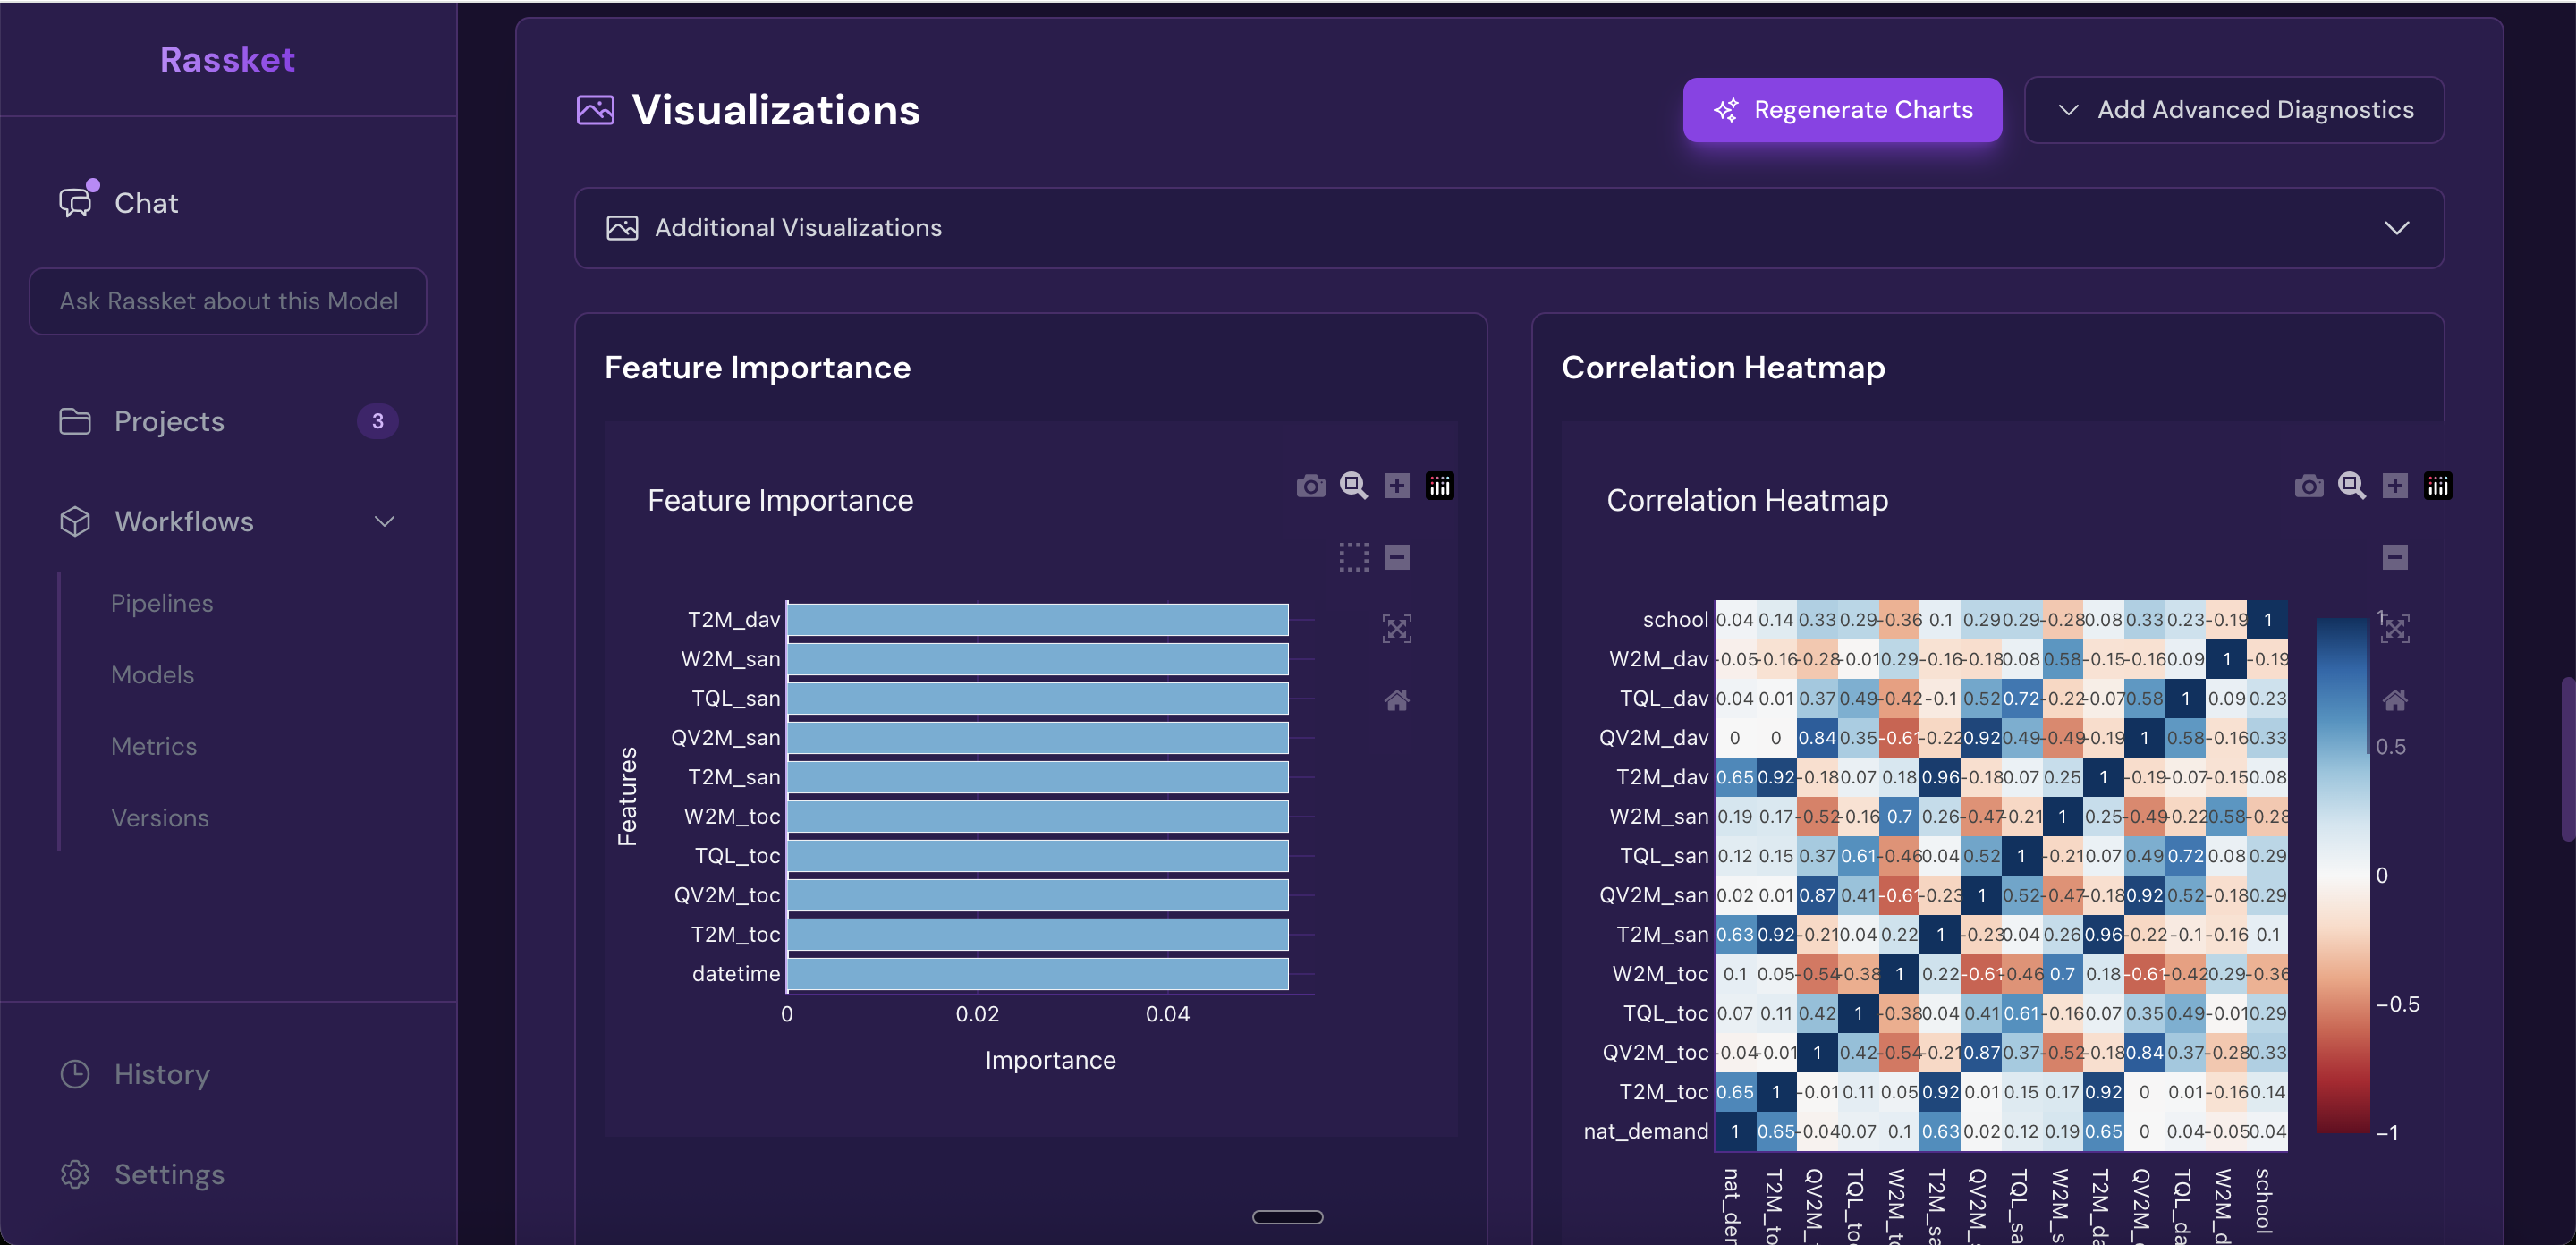
Feature correlation heatmap — understand how your input signals relate to each other.
Natural Language Queries
Once your prediction model is trained, you can ask questions about your data and results in plain English. Rassket answers in the context of your energy domain and utility — no SQL, no coding, no technical background needed.
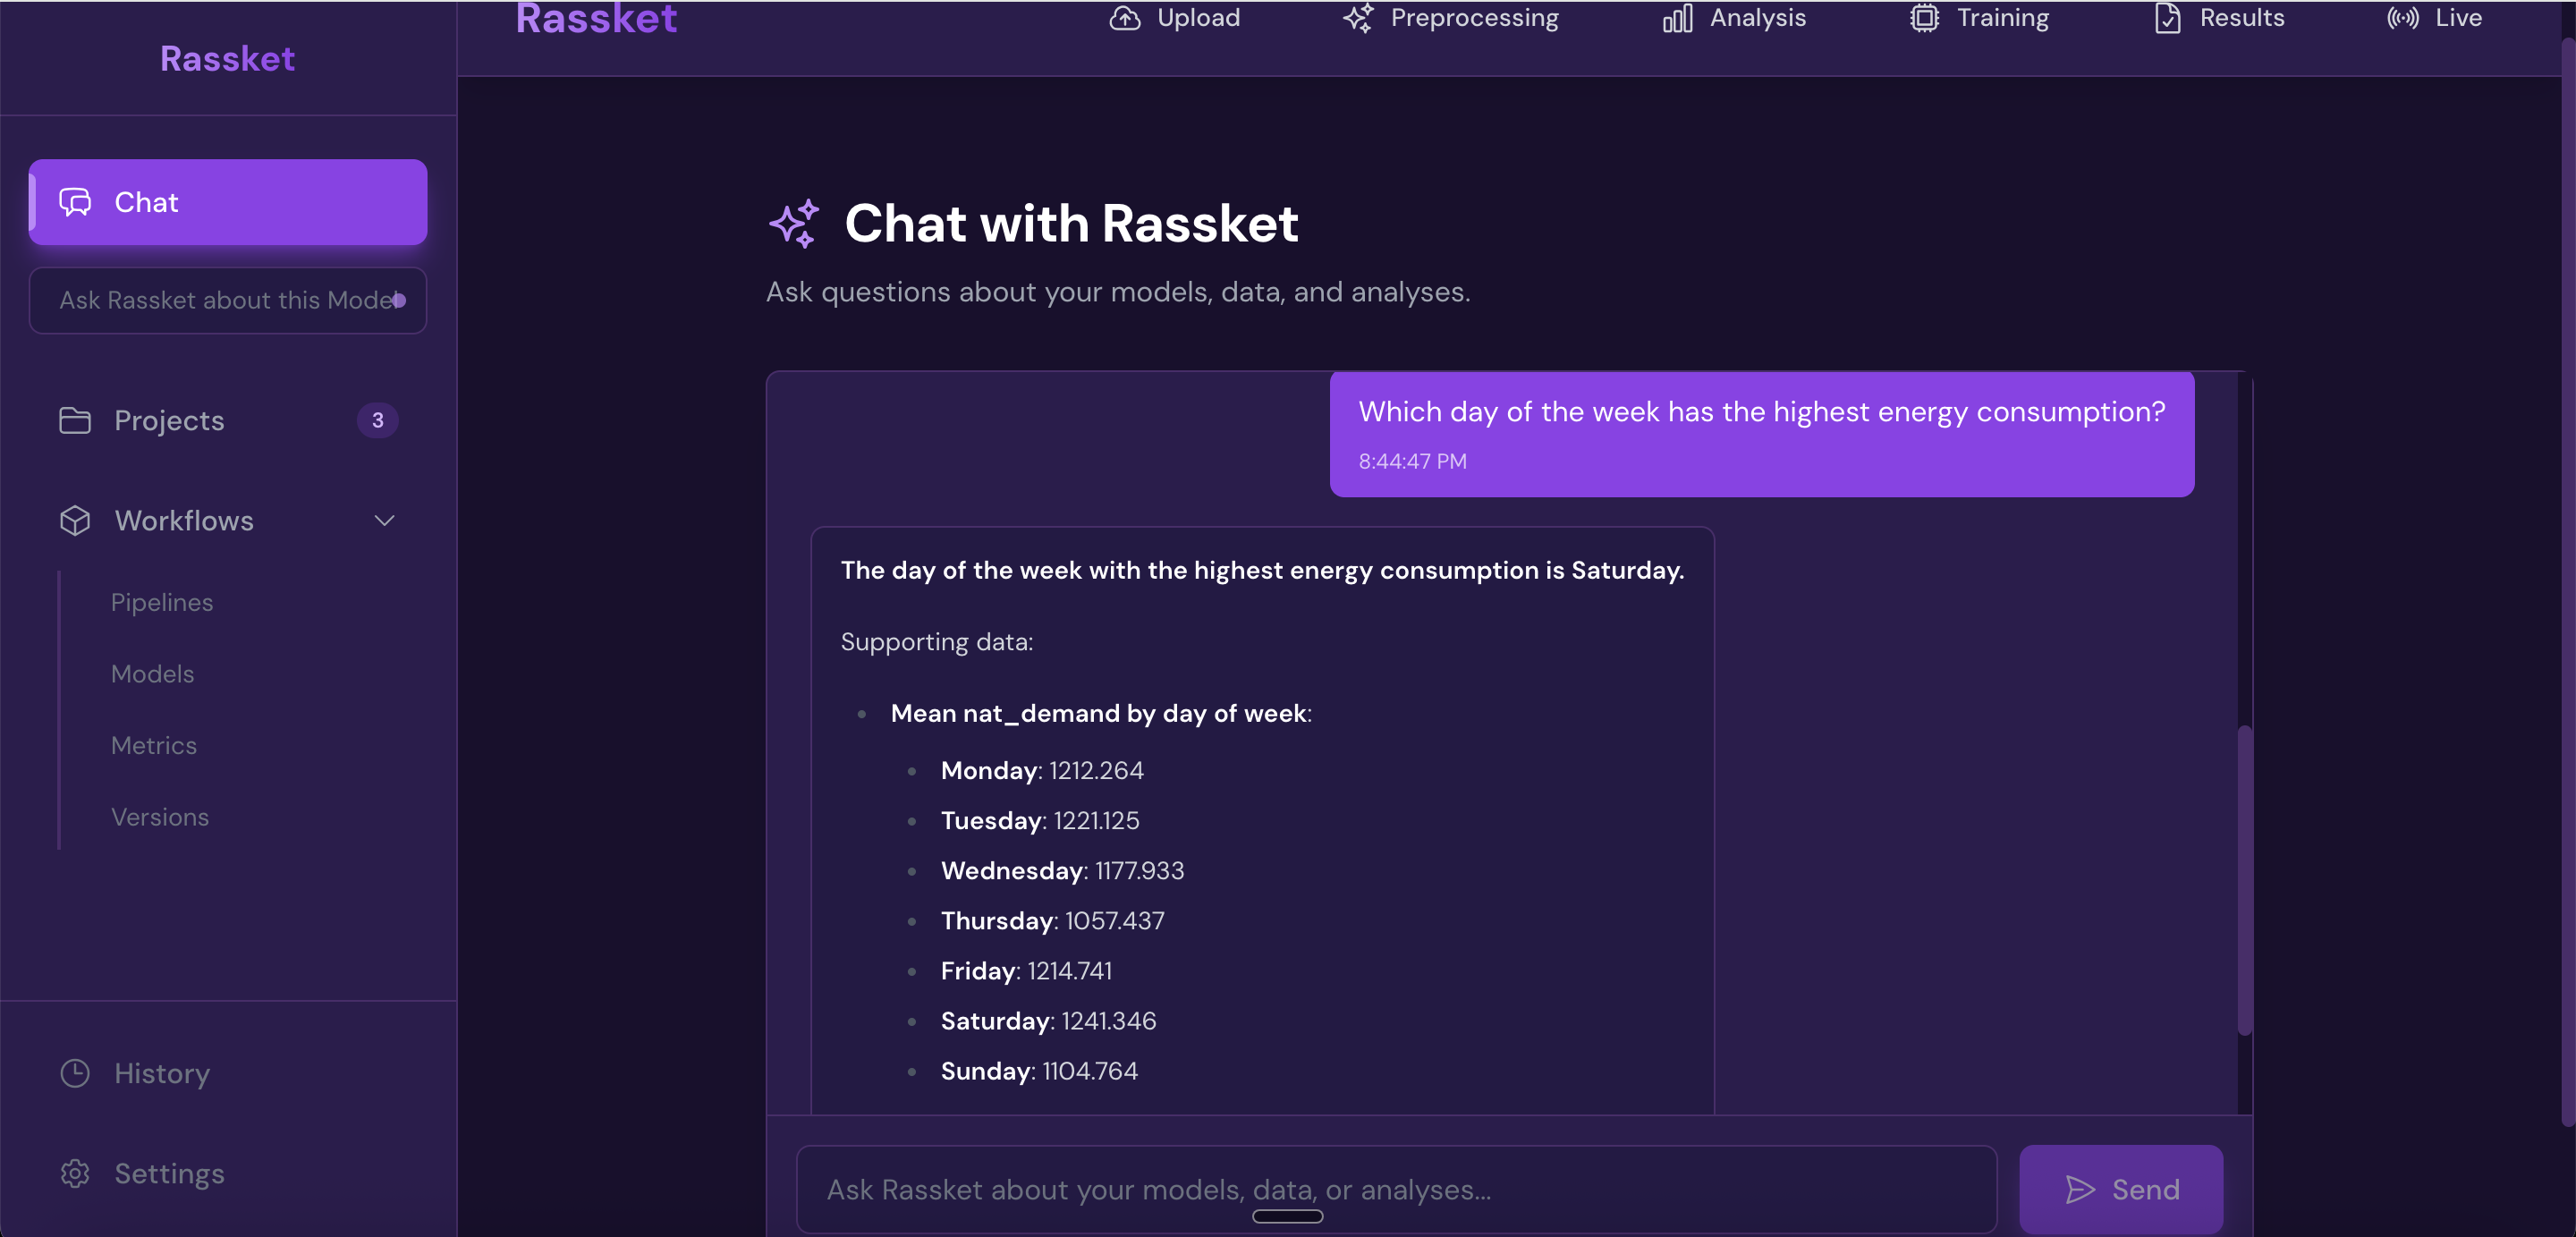
Ask your forecast questions in plain English — Rassket answers with context from your energy domain.
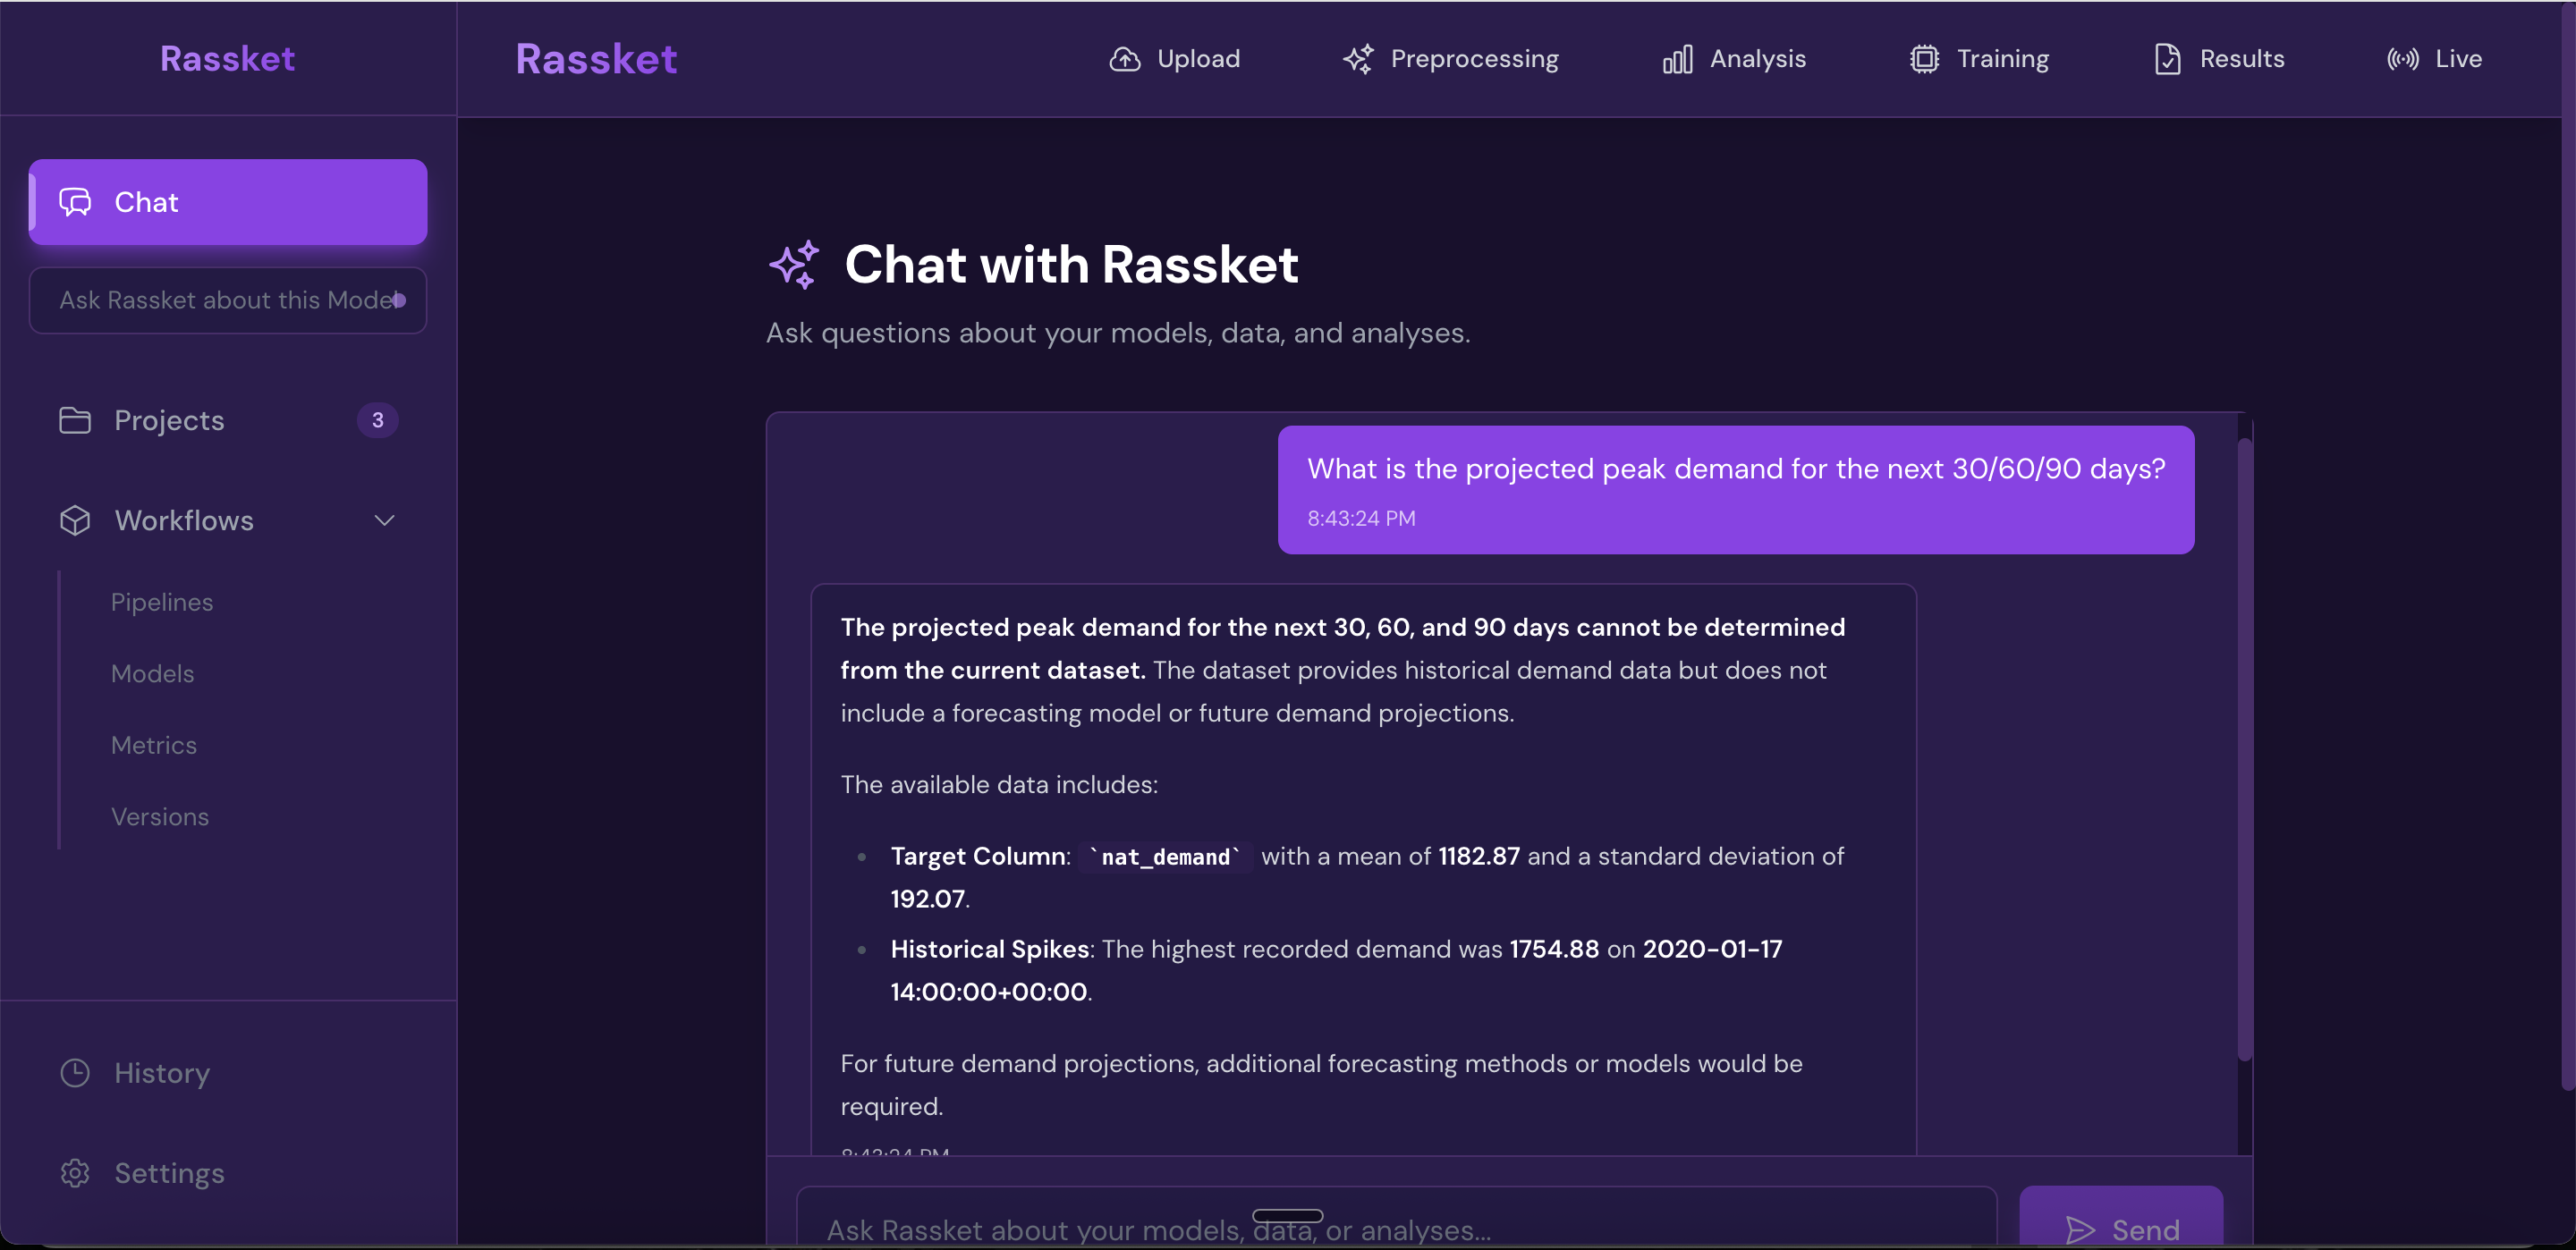
Decision simulations — run what-if scenarios and get answers grounded in your actual data.
Export Options
All results can be exported in the format that works for your workflow.
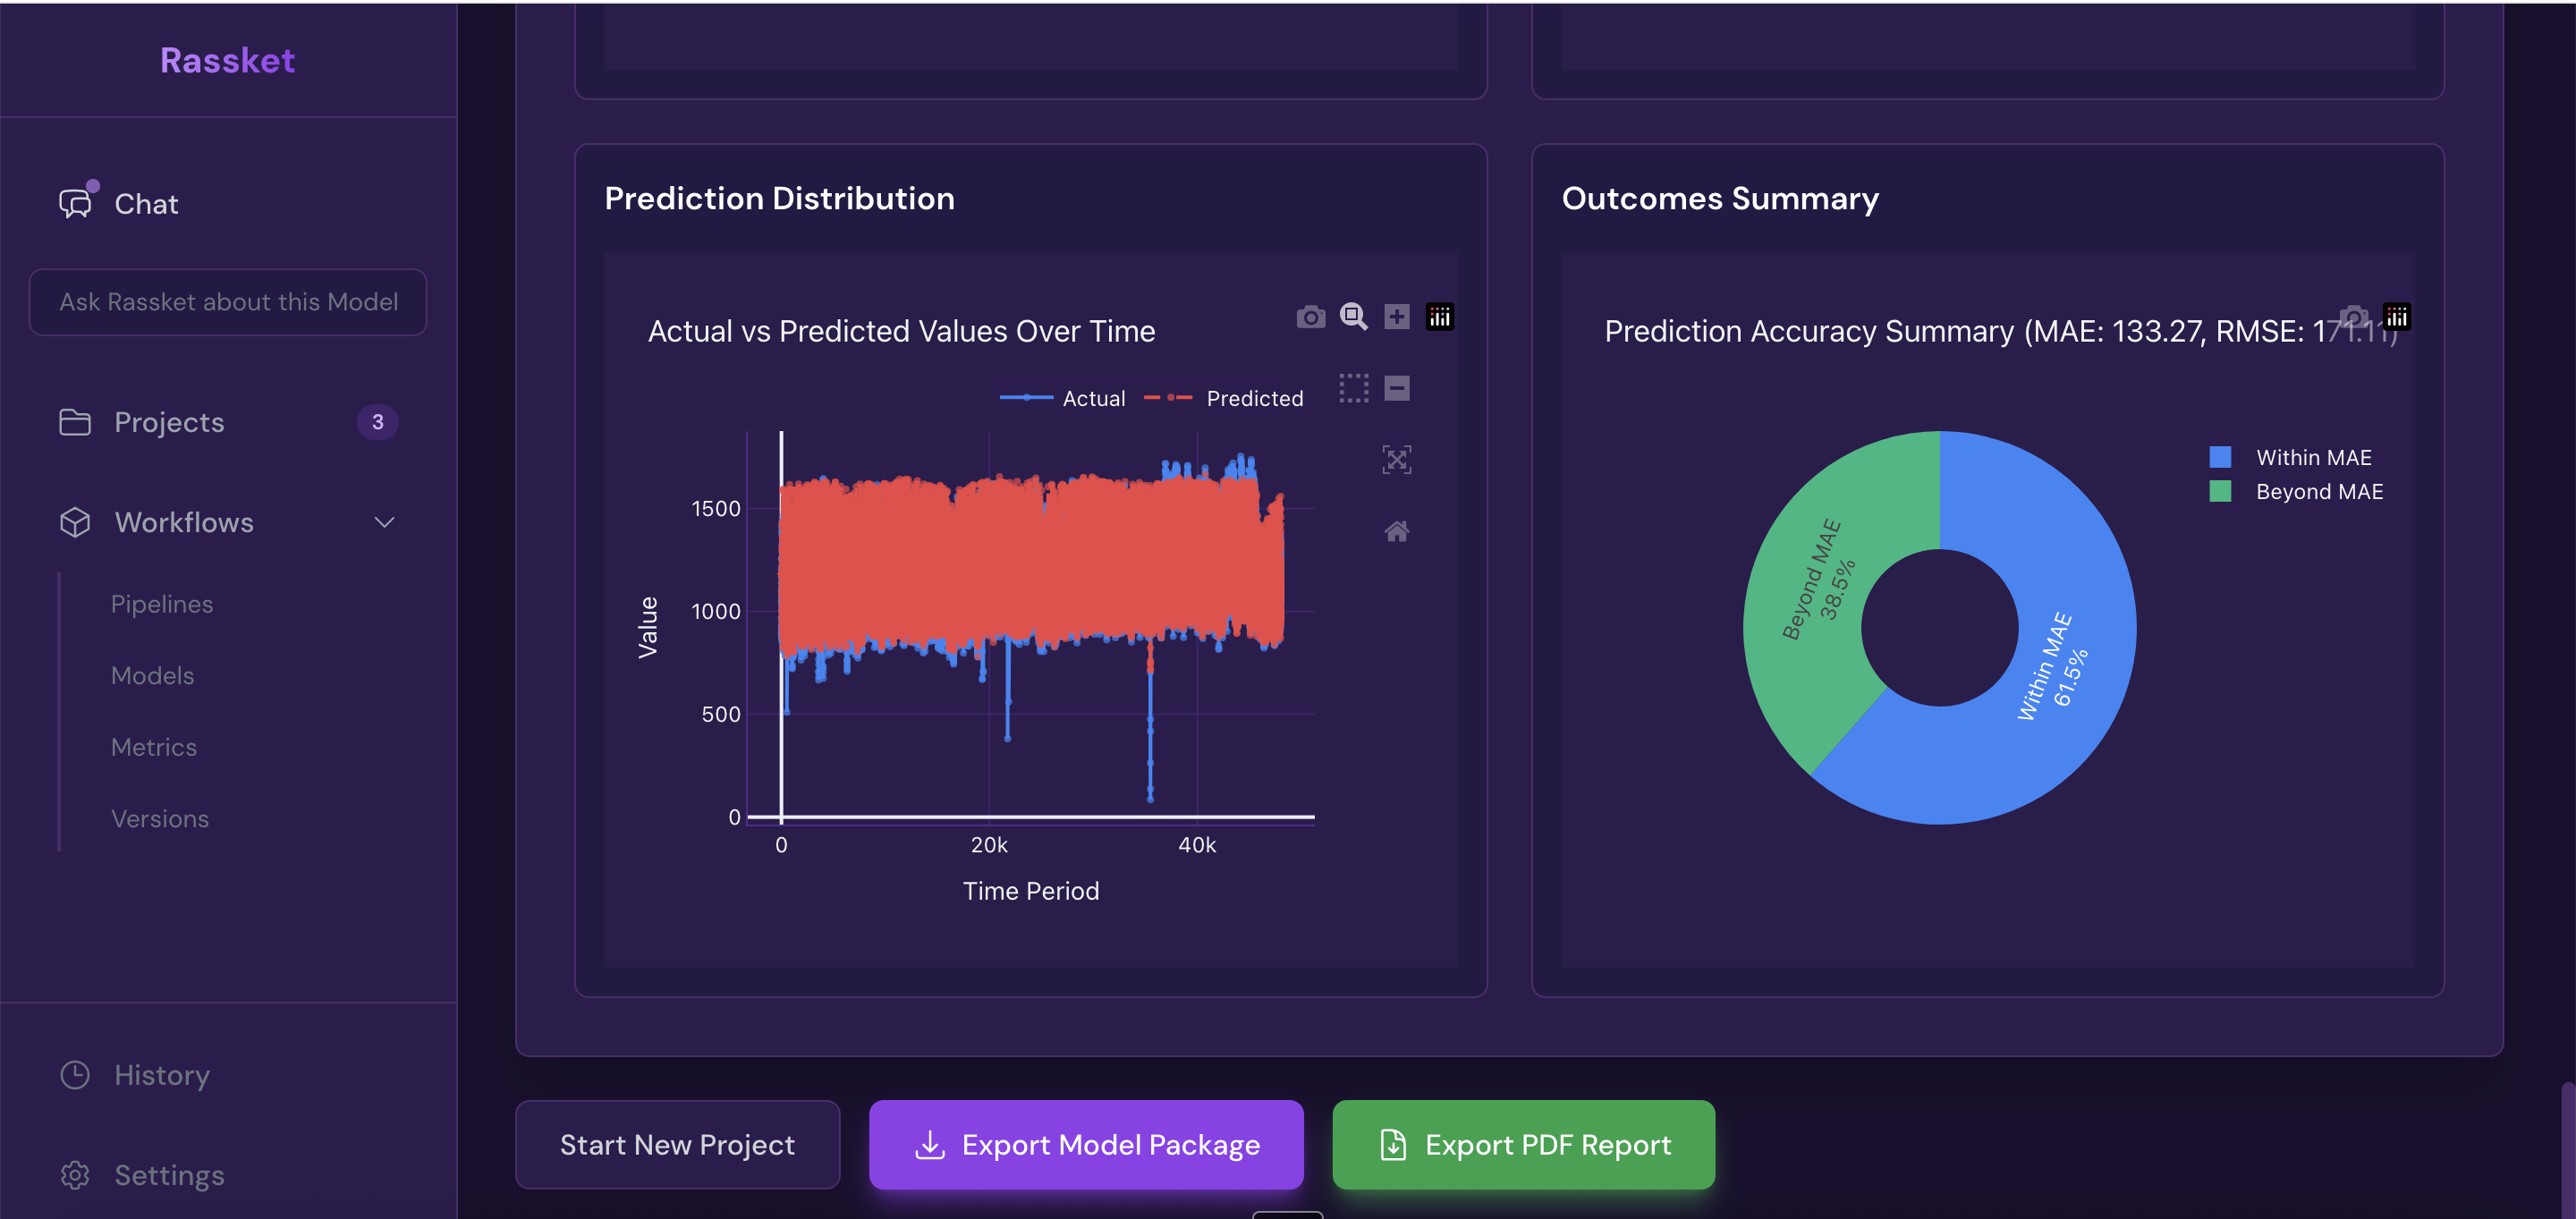
Get forecast curves, plain-English explanations, and export-ready results.
PDF Report
A shareable PDF report that includes:
- Executive summary of forecast results
- Forecast curves with confidence intervals
- Feature importance and plain-English explanations
- Full accuracy metrics
- Domain-aware insights for your utility context
CSV Export
Raw forecast data including:
- Predicted values at each time step
- Upper and lower confidence intervals
- Feature importance summary
API Access
Integrate Rassket forecasts directly into your operational systems. The API delivers the same forecast data and confidence intervals available in the dashboard. Contact support for API credentials and documentation.
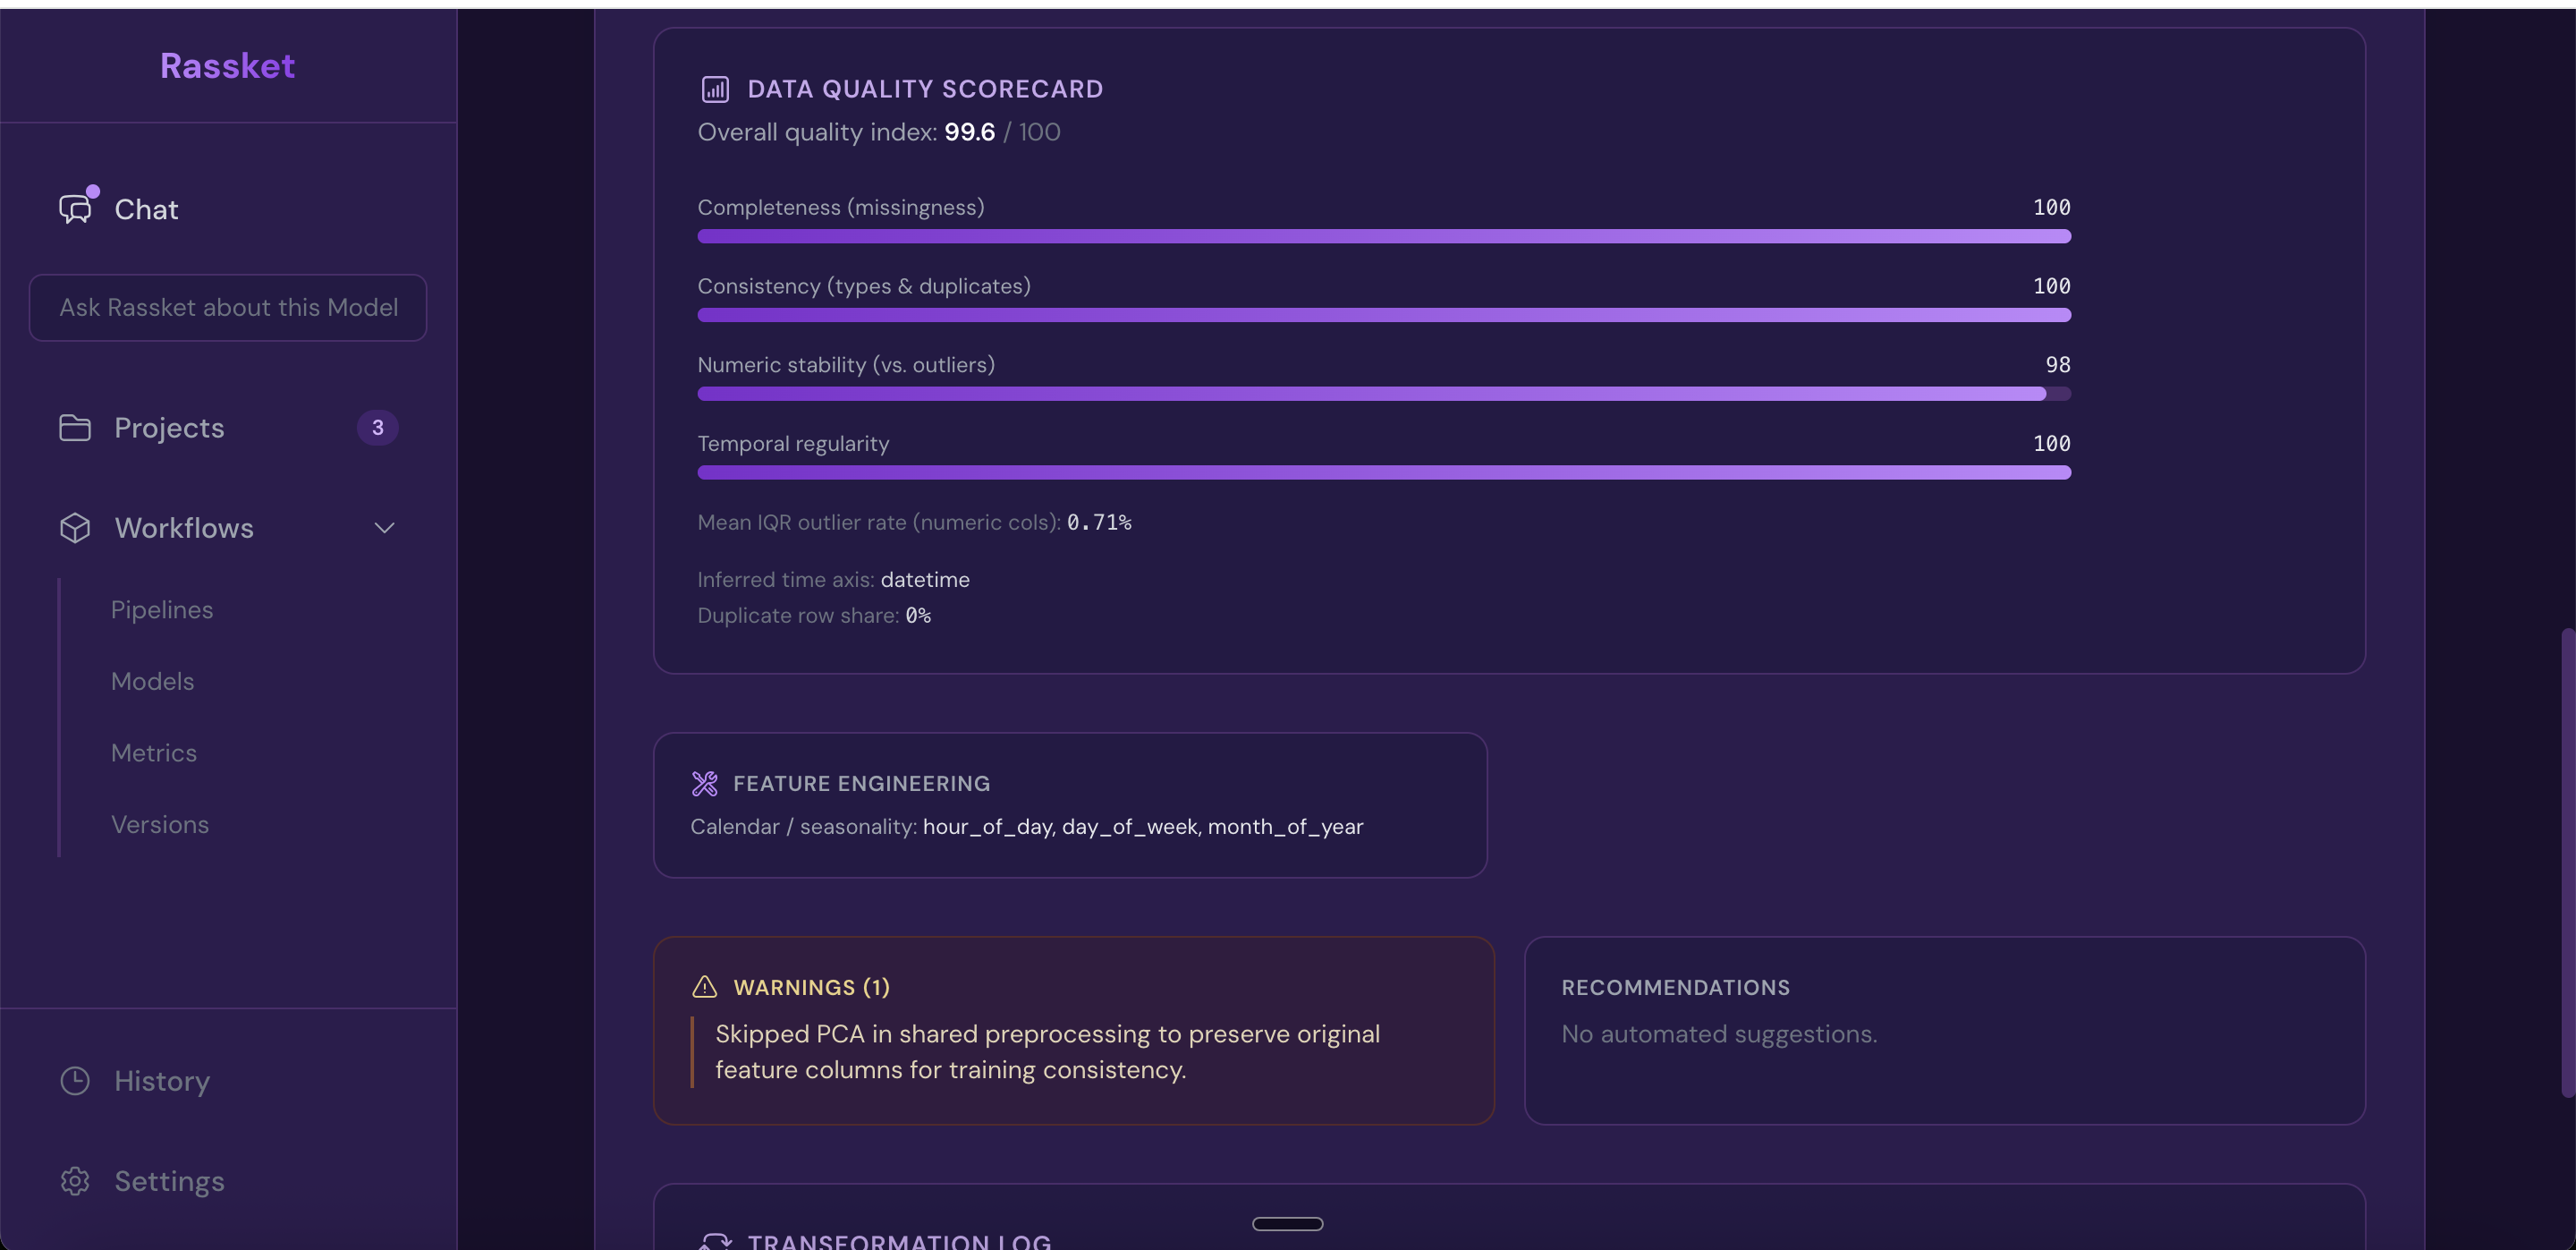
Summary Statistics
Summary statistics — a quick overview of your dataset and prediction model performance.
Data Privacy in Exports
- Exports contain forecast results and aggregated metrics — never raw customer or meter data
- All data is encrypted at rest and in transit
- Full audit trail is maintained on every training run
Next Steps
- Continue to Operations when you need peaks, action windows, and alerts for running the grid
- Read the FAQ for common questions about results and exports
- Explore Use Cases to see how outputs are used in practice
- Return to How It Works for a full workflow walkthrough